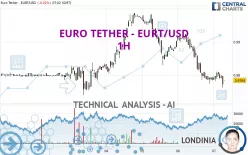
EURO TETHER - EURT/USD - 1H - Technical analysis published on 10/07/2022 (GMT)
- 180
- 0
Click here for a new analysis!
- Timeframe : 1H
- - Analysis generated on
- Status : LEVEL MAINTAINED

Summary of the analysis
Additional analysis
Quotes
The EURO TETHER - EURT/USD rating is 0.978400 USD. The price is lower by -0.02% since the last closing and was traded between 0.976100 USD and 0.981000 USD over the period. The price is currently at +0.24% from its lowest and -0.27% from its highest.A study of price movements over other periods shows the following variations:
Near a new LOW record (1 year)
Type : Bearish
Timeframe : Weekly
Near a new HIGH record (1 month)
Type : Bullish
Timeframe : Weekly
Technical
Technical analysis of EURO TETHER - EURT/USD in 1H shows a overall strongly bearish trend. The signals given by moving averages are 92.86% bearish. This strong bearish trend is confirmed by the strong signals currently being given by short-term moving averages. The Central Indicators scanner detects a bearish signal on moving averages that could impact this trend:
Moving Average bearish crossovers : MA50 & MA100
Type : Bearish
Timeframe : 1 hour
On the 18 technical indicators analysed, 8 are bullish, 5 are neutral and 5 are bearish. Caution: the Central Indicators scanner currently detects an excess:
Williams %R indicator is oversold : under -80
Type : Neutral
Timeframe : 1 hour
An analysis of the price chart with the Central Patterns scanner (detector of chart patterns and resistances and supports) shows a result that can have an impact on the price change:
Near horizontal resistance
Type : Bearish
Timeframe : 1 hour
For a small setback in the very short term, the Central Candlesticks scanner currently notes the presence of this bearish pattern in Japanese candlesticks:
Bearish engulfing lines
Type : Bearish
Timeframe : 1 hour
| S3 | S2 | S1 | Price | R1 | R2 | R3 | |
|---|---|---|---|---|---|---|---|
| ProTrendLines | 0.959300 | 0.963500 | 0.973933 | 0.978400 | 0.979509 | 0.982300 | 0.992300 |
| Change (%) | -1.95% | -1.52% | -0.46% | - | +0.11% | +0.40% | +1.42% |
| Change | -0.019100 | -0.014900 | -0.004467 | - | +0.001109 | +0.003900 | +0.013900 |
| Level | Minor | Minor | Major | - | Major | Major | Minor |
Pivot points can also be used to set your price objectives. Here is the price situation in relation to pivot points:
| Pivot points | S3 | S2 | S1 | PP | R1 | R2 | R3 |
|---|---|---|---|---|---|---|---|
| Standard | 0.958333 | 0.967867 | 0.973233 | 0.982767 | 0.988133 | 0.997667 | 1.003033 |
| Camarilla | 0.974503 | 0.975868 | 0.977234 | 0.978600 | 0.979966 | 0.981332 | 0.982698 |
| Woodie | 0.956250 | 0.966825 | 0.971150 | 0.981725 | 0.986050 | 0.996625 | 1.000950 |
| Fibonacci | 0.967867 | 0.973559 | 0.977075 | 0.982767 | 0.988459 | 0.991975 | 0.997667 |
| Pivot points | S3 | S2 | S1 | PP | R1 | R2 | R3 |
|---|---|---|---|---|---|---|---|
| Standard | 0.930133 | 0.941967 | 0.961033 | 0.972867 | 0.991933 | 1.003767 | 1.022833 |
| Camarilla | 0.971603 | 0.974435 | 0.977268 | 0.980100 | 0.982933 | 0.985765 | 0.988598 |
| Woodie | 0.933750 | 0.943775 | 0.964650 | 0.974675 | 0.995550 | 1.005575 | 1.026450 |
| Fibonacci | 0.941967 | 0.953771 | 0.961063 | 0.972867 | 0.984671 | 0.991963 | 1.003767 |
| Pivot points | S3 | S2 | S1 | PP | R1 | R2 | R3 |
|---|---|---|---|---|---|---|---|
| Standard | 0.884533 | 0.919167 | 0.949733 | 0.984367 | 1.014933 | 1.049567 | 1.080133 |
| Camarilla | 0.962370 | 0.968347 | 0.974323 | 0.980300 | 0.986277 | 0.992253 | 0.998230 |
| Woodie | 0.882500 | 0.918150 | 0.947700 | 0.983350 | 1.012900 | 1.048550 | 1.078100 |
| Fibonacci | 0.919167 | 0.944073 | 0.959460 | 0.984367 | 1.009273 | 1.024660 | 1.049567 |
Numerical data
The following is the status of the technical indicators and moving averages at the time of publication of this technical analysis:
| RSI (14): | 38.41 | |
| MACD (12,26,9): | -0.0021 | |
| Directional Movement: | -17.507207 | |
| AROON (14): | -28.571429 | |
| DEMA (21): | 0.978133 | |
| Parabolic SAR (0,02-0,02-0,2): | 0.977679 | |
| Elder Ray (13): | -0.000983 | |
| Super Trend (3,10): | 0.983797 | |
| Zig ZAG (10): | 0.979100 | |
| VORTEX (21): | 0.7254 | |
| Stochastique (14,3,5): | 46.82 | |
| TEMA (21): | 0.977970 | |
| Williams %R (14): | -44.44 | |
| Chande Momentum Oscillator (20): | 0.000300 | |
| Repulse (5,40,3): | 0.0134 | |
| ROCnROLL: | 2 | |
| TRIX (15,9): | -0.0370 | |
| Courbe Coppock: | 0.59 |
| MA7: | 0.983914 | |
| MA20: | 0.980610 | |
| MA50: | 0.991658 | |
| MA100: | 1.005409 | |
| MAexp7: | 0.979174 | |
| MAexp20: | 0.981253 | |
| MAexp50: | 0.984391 | |
| MAexp100: | 0.984557 | |
| Price / MA7: | -0.56% | |
| Price / MA20: | -0.23% | |
| Price / MA50: | -1.34% | |
| Price / MA100: | -2.69% | |
| Price / MAexp7: | -0.08% | |
| Price / MAexp20: | -0.29% | |
| Price / MAexp50: | -0.61% | |
| Price / MAexp100: | -0.63% |
About author

Online


Add a comment
Comments
0 comments on the analysis EURO TETHER - EURT/USD - 1H