EURO TETHER - EURT/USD - 1H - Technical analysis published on 10/02/2022 (GMT)
- 161
- 0
Click here for a new analysis!
- Timeframe : 1H
- - Analysis generated on
- Status : LEVEL MAINTAINED

Summary of the analysis
Additional analysis
Quotes
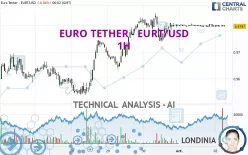
The EURO TETHER - EURT/USD price is 0.979700 USD. The price is lower by -0.04% since the last closing and was traded between 0.979500 USD and 0.980200 USD over the period. The price is currently at +0.02% from its lowest and -0.05% from its highest.A bearish opening was detected by the Central Gaps scanner. Sellers are trying to impose a bearish trend in the very short term.
Bearish opening
Type : Bearish
Timeframe : Openning
So that you have an overall view of the price change, here is a table showing the variations over several periods:
Near a new LOW record (1 year)
Type : Bearish
Timeframe : Weekly
Near a new HIGH record (1 month)
Type : Bullish
Timeframe : Weekly
Technical
Technical analysis of EURO TETHER - EURT/USD in 1H shows an overall bullish trend. The signals given by moving averages are 67.86% bullish. This bullish trend could slow down given the neutral signals currently being given by short-term moving averages. The Central Indicators market scanner currently does not detect any result that concerns moving averages.
The probability of a further increase is slight given the direction of the technical indicators.
But beware of excesses. The Central Indicators scanner currently detects this:
CCI indicator is oversold : under -100
Type : Neutral
Timeframe : 1 hour
Central Patterns, the market scanner focusing on chart patterns, resistances and supports found these results:
Near horizontal support
Type : Bullish
Timeframe : 1 hour
Near support of channel
Type : Bullish
Timeframe : 1 hour
There is also a Japanese candlestick pattern detected by Central Candlesticks that could mark the end of the current short-term trend:
Doji
Type : Neutral
Timeframe : 1 hour
| S3 | S2 | S1 | Price | R1 | R2 | R3 | |
|---|---|---|---|---|---|---|---|
| ProTrendLines | 0.953800 | 0.963500 | 0.969311 | 0.979700 | 0.981000 | 0.984620 | 1.001500 |
| Change (%) | -2.64% | -1.65% | -1.06% | - | +0.13% | +0.50% | +2.23% |
| Change | -0.025900 | -0.016200 | -0.010389 | - | +0.001300 | +0.004920 | +0.021800 |
| Level | Minor | Minor | Major | - | Minor | Major | Major |
To determine price objectives, it is also possible to use the pivot points. Here is the price position in relation to pivot points:
| Pivot points | S3 | S2 | S1 | PP | R1 | R2 | R3 |
|---|---|---|---|---|---|---|---|
| Standard | 0.978300 | 0.978900 | 0.979500 | 0.980100 | 0.980700 | 0.981300 | 0.981900 |
| Camarilla | 0.979770 | 0.979880 | 0.979990 | 0.980100 | 0.980210 | 0.980320 | 0.980430 |
| Woodie | 0.978300 | 0.978900 | 0.979500 | 0.980100 | 0.980700 | 0.981300 | 0.981900 |
| Fibonacci | 0.978900 | 0.979358 | 0.979642 | 0.980100 | 0.980558 | 0.980842 | 0.981300 |
| Pivot points | S3 | S2 | S1 | PP | R1 | R2 | R3 |
|---|---|---|---|---|---|---|---|
| Standard | 0.930133 | 0.941967 | 0.961033 | 0.972867 | 0.991933 | 1.003767 | 1.022833 |
| Camarilla | 0.971603 | 0.974435 | 0.977268 | 0.980100 | 0.982933 | 0.985765 | 0.988598 |
| Woodie | 0.933750 | 0.943775 | 0.964650 | 0.974675 | 0.995550 | 1.005575 | 1.026450 |
| Fibonacci | 0.941967 | 0.953771 | 0.961063 | 0.972867 | 0.984671 | 0.991963 | 1.003767 |
| Pivot points | S3 | S2 | S1 | PP | R1 | R2 | R3 |
|---|---|---|---|---|---|---|---|
| Standard | 0.884533 | 0.919167 | 0.949733 | 0.984367 | 1.014933 | 1.049567 | 1.080133 |
| Camarilla | 0.962370 | 0.968347 | 0.974323 | 0.980300 | 0.986277 | 0.992253 | 0.998230 |
| Woodie | 0.882500 | 0.918150 | 0.947700 | 0.983350 | 1.012900 | 1.048550 | 1.078100 |
| Fibonacci | 0.919167 | 0.944073 | 0.959460 | 0.984367 | 1.009273 | 1.024660 | 1.049567 |
Numerical data
The following is the status of technical indicators and moving averages registered at the time this technical analysis was created:
| RSI (14): | 52.96 | |
| MACD (12,26,9): | 0.0002 | |
| Directional Movement: | -4.051358 | |
| AROON (14): | 35.714286 | |
| DEMA (21): | 0.980194 | |
| Parabolic SAR (0,02-0,02-0,2): | 0.977478 | |
| Elder Ray (13): | -0.000135 | |
| Super Trend (3,10): | 0.981550 | |
| Zig ZAG (10): | 0.980100 | |
| VORTEX (21): | 0.9709 | |
| Stochastique (14,3,5): | 46.67 | |
| TEMA (21): | 0.979836 | |
| Williams %R (14): | -40.00 | |
| Chande Momentum Oscillator (20): | 0.000100 | |
| Repulse (5,40,3): | 0.0628 | |
| ROCnROLL: | 1 | |
| TRIX (15,9): | 0.0023 | |
| Courbe Coppock: | 0.04 |
| MA7: | 0.973386 | |
| MA20: | 0.983800 | |
| MA50: | 0.994654 | |
| MA100: | 1.008607 | |
| MAexp7: | 0.980025 | |
| MAexp20: | 0.979933 | |
| MAexp50: | 0.978705 | |
| MAexp100: | 0.975907 | |
| Price / MA7: | +0.65% | |
| Price / MA20: | -0.42% | |
| Price / MA50: | -1.50% | |
| Price / MA100: | -2.87% | |
| Price / MAexp7: | -0.03% | |
| Price / MAexp20: | -0.02% | |
| Price / MAexp50: | +0.10% | |
| Price / MAexp100: | +0.39% |
About author

Online


Add a comment
Comments
0 comments on the analysis EURO TETHER - EURT/USD - 1H