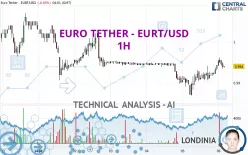
EURO TETHER - EURT/USD - 1H - Technical analysis published on 09/06/2022 (GMT)
- 165
- 0
Click here for a new analysis!
- Timeframe : 1H
- - Analysis generated on
- Status : LEVEL MAINTAINED

Summary of the analysis
Additional analysis
Quotes
The EURO TETHER - EURT/USD rating is 0.994000 USD. On the day, this instrument lost -0.03% and was between 0.993400 USD and 0.996200 USD. This implies that the price is at +0.06% from its lowest and at -0.22% from its highest.The Central Gaps scanner detects a bearish opening. A small advantage for sellers in the very short term.
Bearish opening
Type : Bearish
Timeframe : Openning
So that you have an overall view of the price change, here is a table showing the variations over several periods:
Near a new LOW record (1 year)
Type : Bearish
Timeframe : Weekly
Near a new LOW record (1st january)
Type : Bearish
Timeframe : Weekly
Near a new HIGH record (1 month)
Type : Bullish
Timeframe : Weekly
Technical
Technical analysis of EURO TETHER - EURT/USD in 1H shows an overall slightly bullish trend. 57.14% of the signals given by moving averages are bullish. The overall trend could accelerate as strong bullish signals from short-term moving averages are expected. The Central Indicators scanner detects bullish and bearish signals on moving averages that could impact this trend:
Bearish trend reversal : Moving Average 50
Type : Bearish
Timeframe : 1 hour
Bullish price crossover with Moving Average 100
Type : Bullish
Timeframe : 1 hour
In fact, 13 technical indicators on 18 studied are currently bullish. But beware of excesses. The Central Indicators scanner currently detects this:
CCI indicator is overbought : over 100
Type : Neutral
Timeframe : 1 hour
Central Patterns, the market scanner focusing on chart patterns, resistances and supports found these results:
Near resistance of channel
Type : Bearish
Timeframe : 1 hour
Near horizontal support
Type : Bullish
Timeframe : 1 hour
No result was found by the Central Candlesticks scanner on Japanese candlesticks.
| S2 | S1 | Price | R1 | R2 | R3 | |
|---|---|---|---|---|---|---|
| ProTrendLines | 0.987000 | 0.990600 | 0.994000 | 0.994244 | 0.998067 | 1.001000 |
| Change (%) | -0.70% | -0.34% | - | +0.02% | +0.41% | +0.70% |
| Change | -0.007000 | -0.003400 | - | +0.000244 | +0.004067 | +0.007000 |
| Level | Minor | Minor | - | Major | Minor | Major |
Pivot points can also be used to set your price objectives. Here is the price situation in relation to pivot points:
| Pivot points | S3 | S2 | S1 | PP | R1 | R2 | R3 |
|---|---|---|---|---|---|---|---|
| Standard | 0.982133 | 0.984567 | 0.989433 | 0.991867 | 0.996733 | 0.999167 | 1.004033 |
| Camarilla | 0.992293 | 0.992962 | 0.993631 | 0.994300 | 0.994969 | 0.995638 | 0.996308 |
| Woodie | 0.983350 | 0.985175 | 0.990650 | 0.992475 | 0.997950 | 0.999775 | 1.005250 |
| Fibonacci | 0.984567 | 0.987355 | 0.989078 | 0.991867 | 0.994655 | 0.996378 | 0.999167 |
| Pivot points | S3 | S2 | S1 | PP | R1 | R2 | R3 |
|---|---|---|---|---|---|---|---|
| Standard | 0.970467 | 0.980233 | 0.987467 | 0.997233 | 1.004467 | 1.014233 | 1.021467 |
| Camarilla | 0.990025 | 0.991583 | 0.993142 | 0.994700 | 0.996258 | 0.997817 | 0.999375 |
| Woodie | 0.969200 | 0.979600 | 0.986200 | 0.996600 | 1.003200 | 1.013600 | 1.020200 |
| Fibonacci | 0.980233 | 0.986727 | 0.990739 | 0.997233 | 1.003727 | 1.007739 | 1.014233 |
| Pivot points | S3 | S2 | S1 | PP | R1 | R2 | R3 |
|---|---|---|---|---|---|---|---|
| Standard | 0.937000 | 0.963400 | 0.983200 | 1.009600 | 1.029400 | 1.055800 | 1.075600 |
| Camarilla | 0.990295 | 0.994530 | 0.998765 | 1.003000 | 1.007235 | 1.011470 | 1.015705 |
| Woodie | 0.933700 | 0.961750 | 0.979900 | 1.007950 | 1.026100 | 1.054150 | 1.072300 |
| Fibonacci | 0.963400 | 0.981048 | 0.991952 | 1.009600 | 1.027248 | 1.038152 | 1.055800 |
Numerical data
The following are the details of the technical indicators and moving averages that were collected to generate this technical analysis:
| RSI (14): | 60.50 | |
| MACD (12,26,9): | 0.0007 | |
| Directional Movement: | 13.163980 | |
| AROON (14): | 71.428572 | |
| DEMA (21): | 0.993657 | |
| Parabolic SAR (0,02-0,02-0,2): | 0.991168 | |
| Elder Ray (13): | 0.001164 | |
| Super Trend (3,10): | 0.991117 | |
| Zig ZAG (10): | 0.994800 | |
| VORTEX (21): | 1.2252 | |
| Stochastique (14,3,5): | 70.83 | |
| TEMA (21): | 0.994640 | |
| Williams %R (14): | -33.93 | |
| Chande Momentum Oscillator (20): | 0.002000 | |
| Repulse (5,40,3): | -0.1155 | |
| ROCnROLL: | 1 | |
| TRIX (15,9): | 0.0043 | |
| Courbe Coppock: | 0.57 |
| MA7: | 0.994457 | |
| MA20: | 0.997520 | |
| MA50: | 1.010788 | |
| MA100: | 1.026354 | |
| MAexp7: | 0.994109 | |
| MAexp20: | 0.992794 | |
| MAexp50: | 0.992974 | |
| MAexp100: | 0.994036 | |
| Price / MA7: | -0.05% | |
| Price / MA20: | -0.35% | |
| Price / MA50: | -1.66% | |
| Price / MA100: | -3.15% | |
| Price / MAexp7: | -0.01% | |
| Price / MAexp20: | +0.12% | |
| Price / MAexp50: | +0.10% | |
| Price / MAexp100: | +0.00% |
About author

Online


Add a comment
Comments
0 comments on the analysis EURO TETHER - EURT/USD - 1H