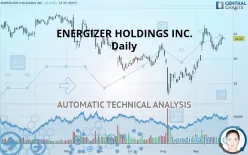
ENERGIZER HOLDINGS INC. - Daily - Technical analysis published on 09/30/2019 (GMT)
- 229
- 0
- Who voted?
Click here for a new analysis!
- Timeframe : Daily
- - Analysis generated on
- Status : INVALID

Summary of the analysis

Additional analysis
Quotes
The ENERGIZER HOLDINGS INC. rating is 44.02 USD. The price registered an increase of +0.11% on the session and was traded between 43.99 USD and 44.22 USD over the period. The price is currently at +0.07% from its lowest and -0.45% from its highest.The Central Gaps scanner detects a bullish gap which is a sign that buyers have taken the lead in the very short term.
Opening Gap UP
Type : Bullish
Timeframe : Openning
A study of price movements over other periods shows the following variations:
Near a new HIGH record (1 month)
Type : Bullish
Timeframe : Weekly
Technical
Technical analysis of ENERGIZER HOLDINGS INC. in Daily shows an overall bullish trend. The signals returned by the moving averages are 75% bullish. This bullish trend is reinforced by the strong signals currently being given by short-term moving averages. There is no crossing of moving average by the price or crossing of moving averages between themselves.
In fact, Central Analyzer took into account 18 technical indicators and the result was as follows: 7 are bullish, 5 are neutral and 6 are bearish. Caution: the Central Indicators scanner currently detects an excess:
Williams %R indicator is overbought : over -20
Type : Neutral
Timeframe : Daily
Aroon indicator bearish trend
Type : Bearish
Timeframe : Daily
Price is back over the pivot point
Type : Bullish
Timeframe : Daily
Price is back under the pivot point
Type : Bearish
Timeframe : Weekly
Williams %R indicator is back over -50
Type : Bullish
Timeframe : Daily
Central Patterns, the scanner specializing in chart patterns, did not identify any signals.
No result was found by the Central Candlesticks scanner on Japanese candlesticks.
| S3 | S2 | S1 | Price | R1 | R2 | R3 | |
|---|---|---|---|---|---|---|---|
| ProTrendLines | 37.53 | 41.14 | 42.42 | 44.02 | 44.35 | 46.03 | 48.61 |
| Change (%) | -14.74% | -6.54% | -3.63% | - | +0.75% | +4.57% | +10.43% |
| Change | -6.49 | -2.88 | -1.60 | - | +0.33 | +2.01 | +4.59 |
| Level | Intermediate | Major | Major | - | Intermediate | Major | Major |
Attention could also be paid to pivot points to set price objectives:
| Pivot points | S3 | S2 | S1 | PP | R1 | R2 | R3 |
|---|---|---|---|---|---|---|---|
| Standard | 41.37 | 41.99 | 43.05 | 43.67 | 44.73 | 45.35 | 46.41 |
| Camarilla | 43.64 | 43.79 | 43.95 | 44.10 | 44.25 | 44.41 | 44.56 |
| Woodie | 41.58 | 42.10 | 43.26 | 43.78 | 44.94 | 45.46 | 46.62 |
| Fibonacci | 41.99 | 42.64 | 43.03 | 43.67 | 44.32 | 44.71 | 45.35 |
| Pivot points | S3 | S2 | S1 | PP | R1 | R2 | R3 |
|---|---|---|---|---|---|---|---|
| Standard | 36.78 | 39.17 | 40.54 | 42.93 | 44.30 | 46.69 | 48.06 |
| Camarilla | 40.88 | 41.22 | 41.57 | 41.91 | 42.26 | 42.60 | 42.94 |
| Woodie | 36.27 | 38.92 | 40.03 | 42.68 | 43.79 | 46.44 | 47.55 |
| Fibonacci | 39.17 | 40.61 | 41.49 | 42.93 | 44.37 | 45.25 | 46.69 |
| Pivot points | S3 | S2 | S1 | PP | R1 | R2 | R3 |
|---|---|---|---|---|---|---|---|
| Standard | 22.49 | 27.38 | 32.94 | 37.83 | 43.39 | 48.29 | 53.85 |
| Camarilla | 35.63 | 36.58 | 37.54 | 38.50 | 39.46 | 40.42 | 41.38 |
| Woodie | 22.82 | 27.55 | 33.27 | 38.00 | 43.73 | 48.45 | 54.18 |
| Fibonacci | 27.38 | 31.37 | 33.84 | 37.83 | 41.83 | 44.29 | 48.29 |
Numerical data
The following is the status of the technical indicators and moving averages at the time of publication of this technical analysis:
| RSI (14): | 61.74 | |
| MACD (12,26,9): | 1.2400 | |
| Directional Movement: | 16.58 | |
| AROON (14): | -57.14 | |
| DEMA (21): | 43.90 | |
| Parabolic SAR (0,02-0,02-0,2): | 45.20 | |
| Elder Ray (13): | 1.24 | |
| Super Trend (3,10): | 40.56 | |
| Zig ZAG (10): | 43.97 | |
| VORTEX (21): | 1.2100 | |
| Stochastique (14,3,5): | 48.33 | |
| TEMA (21): | 44.46 | |
| Williams %R (14): | -52.08 | |
| Chande Momentum Oscillator (20): | -2.03 | |
| Repulse (5,40,3): | 1.1300 | |
| ROCnROLL: | 1 | |
| TRIX (15,9): | 0.5200 | |
| Courbe Coppock: | 10.03 |
| MA7: | 43.21 | |
| MA20: | 42.59 | |
| MA50: | 39.58 | |
| MA100: | 40.56 | |
| MAexp7: | 43.53 | |
| MAexp20: | 42.23 | |
| MAexp50: | 40.84 | |
| MAexp100: | 41.30 | |
| Price / MA7: | +1.87% | |
| Price / MA20: | +3.36% | |
| Price / MA50: | +11.22% | |
| Price / MA100: | +8.53% | |
| Price / MAexp7: | +1.13% | |
| Price / MAexp20: | +4.24% | |
| Price / MAexp50: | +7.79% | |
| Price / MAexp100: | +6.59% |
News
The latest news and videos published on ENERGIZER HOLDINGS INC. at the time of the analysis were as follows:
- Energizer Holdings, Inc. Announces Pricing Of Common Stock And Mandatory Convertible Preferred Stock
- Energizer Holdings, Inc. Announces Commencement of Offering of $600 Million Senior Notes
- Energizer Holdings, Inc. Announces Offerings Of Common Stock And Mandatory Convertible Preferred Stock
- Energizer Holdings, Inc. Provides Preliminary Selected Financial Data for the Fiscal 2019 First Quarter
- Energizer® Sets GUINNESS WORLD RECORDS™ Title for the Longest-Lasting AA Battery
About author

Online


Add a comment
Comments
0 comments on the analysis ENERGIZER HOLDINGS INC. - Daily