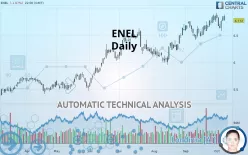
ENEL - Daily - Technical analysis published on 10/09/2019 (GMT)
- 341
- 0
Click here for a new analysis!
- Timeframe : Daily
- - Analysis generated on
- Status : TARGET REACHED

Summary of the analysis

Additional analysis
Quotes
The ENEL price is 6.772 EUR. On the day, this instrument lost -1.07% and was traded between 6.772 EUR and 6.878 EUR over the period. The price is currently at 0% from its lowest and -1.54% from its highest.The Central Gaps scanner detects a bullish opening. A small advantage for buyers in the very short term.
Bullish opening
Type : Bullish
Timeframe : Openning
Here is a more detailed summary of the historical variations registered by ENEL:
New HIGH record (5 years)
Type : Bullish
Timeframe : Weekly
Near a new HIGH record (1 year)
Type : Bullish
Timeframe : Weekly
Near a new HIGH record (1st january)
Type : Bullish
Timeframe : Weekly
Near a new HIGH record (1 month)
Type : Bullish
Timeframe : Weekly
Technical
Technical analysis of this Daily chart of ENEL indicates that the overall trend is strongly bullish. The signals given by the moving averages are 92.86% bullish. This strong bullish trend is confirmed by the strong signals currently being given by short-term moving averages. An assessment of moving averages reveals several bullish signals that could impact this trend:
Bullish trend reversal : Moving Average 20
Type : Bullish
Timeframe : Daily
Bullish price crossover with Moving Average 20
Type : Bullish
Timeframe : Daily
In fact, according to the parameters integrated into the Central Analyzer system, 11 technical indicators out of 18 analysed are currently bullish. But beware of excesses. The Central Indicators scanner currently detects this:
MACD indicator: bullish divergence
Type : Bullish
Timeframe : Daily
Williams %R indicator is overbought : over -20
Type : Neutral
Timeframe : Daily
Pivot points : price is over resistance 1
Type : Neutral
Timeframe : Daily
Price is back over the pivot point
Type : Bullish
Timeframe : Weekly
Williams %R indicator is back over -50
Type : Bullish
Timeframe : Daily
Central Patterns, the market scanner focusing on chart patterns, resistances and supports found these results:
Near resistance of channel
Type : Bearish
Timeframe : Daily
Horizontal resistance is broken
Type : Bullish
Timeframe : Daily
For a small rebound in the very short term, the Central Candlesticks scanner currently notes the presence of this bullish pattern in Japanese candlesticks:
Bullish engulfing lines
Type : Bullish
Timeframe : Daily
| S3 | S2 | S1 | Price | R1 | R2 | |
|---|---|---|---|---|---|---|
| ProTrendLines | 5.580 | 6.009 | 6.443 | 6.772 | 6.786 | 7.544 |
| Change (%) | -17.60% | -11.27% | -4.86% | - | +0.21% | +11.40% |
| Change | -1.192 | -0.763 | -0.329 | - | +0.014 | +0.772 |
| Level | Major | Minor | Major | - | Major | Intermediate |
Pivot points can also be used to set your price objectives. Here is the price situation in relation to pivot points:
| Pivot points | S3 | S2 | S1 | PP | R1 | R2 | R3 |
|---|---|---|---|---|---|---|---|
| Standard | 6.427 | 6.503 | 6.629 | 6.705 | 6.831 | 6.907 | 7.033 |
| Camarilla | 6.698 | 6.717 | 6.736 | 6.754 | 6.773 | 6.791 | 6.810 |
| Woodie | 6.451 | 6.516 | 6.653 | 6.718 | 6.855 | 6.920 | 7.057 |
| Fibonacci | 6.503 | 6.581 | 6.628 | 6.705 | 6.783 | 6.830 | 6.907 |
| Pivot points | S3 | S2 | S1 | PP | R1 | R2 | R3 |
|---|---|---|---|---|---|---|---|
| Standard | 6.372 | 6.493 | 6.639 | 6.760 | 6.906 | 7.027 | 7.173 |
| Camarilla | 6.713 | 6.737 | 6.762 | 6.786 | 6.811 | 6.835 | 6.859 |
| Woodie | 6.386 | 6.499 | 6.653 | 6.766 | 6.920 | 7.033 | 7.187 |
| Fibonacci | 6.493 | 6.595 | 6.658 | 6.760 | 6.862 | 6.925 | 7.027 |
| Pivot points | S3 | S2 | S1 | PP | R1 | R2 | R3 |
|---|---|---|---|---|---|---|---|
| Standard | 6.086 | 6.250 | 6.551 | 6.715 | 7.016 | 7.180 | 7.481 |
| Camarilla | 6.723 | 6.766 | 6.808 | 6.851 | 6.894 | 6.936 | 6.979 |
| Woodie | 6.154 | 6.284 | 6.619 | 6.749 | 7.084 | 7.214 | 7.549 |
| Fibonacci | 6.250 | 6.428 | 6.538 | 6.715 | 6.893 | 7.003 | 7.180 |
Numerical data
The following is the status of the technical indicators and moving averages at the time of publication of this technical analysis:
| RSI (14): | 60.41 | |
| MACD (12,26,9): | 0.0820 | |
| Directional Movement: | 12.124 | |
| AROON (14): | 71.429 | |
| DEMA (21): | 6.797 | |
| Parabolic SAR (0,02-0,02-0,2): | 6.890 | |
| Elder Ray (13): | 0.076 | |
| Super Trend (3,10): | 6.490 | |
| Zig ZAG (10): | 6.845 | |
| VORTEX (21): | 1.0360 | |
| Stochastique (14,3,5): | 61.68 | |
| TEMA (21): | 6.802 | |
| Williams %R (14): | -15.88 | |
| Chande Momentum Oscillator (20): | 0.230 | |
| Repulse (5,40,3): | 1.9560 | |
| ROCnROLL: | 1 | |
| TRIX (15,9): | 0.1930 | |
| Courbe Coppock: | 6.44 |
| MA7: | 6.766 | |
| MA20: | 6.667 | |
| MA50: | 6.466 | |
| MA100: | 6.278 | |
| MAexp7: | 6.757 | |
| MAexp20: | 6.684 | |
| MAexp50: | 6.521 | |
| MAexp100: | 6.285 | |
| Price / MA7: | +0.09% | |
| Price / MA20: | +1.57% | |
| Price / MA50: | +4.73% | |
| Price / MA100: | +7.87% | |
| Price / MAexp7: | +0.22% | |
| Price / MAexp20: | +1.32% | |
| Price / MAexp50: | +3.85% | |
| Price / MAexp100: | +7.75% |
News
The latest news and videos published on ENEL at the time of the analysis were as follows:
- Enel Américas Announces Launch of its Subsequent Rights Offerings in Connection with Capital Increase
- Enel Américas Announces Launch of its Preemptive Rights Offerings in Connection with Capital Increase
-
 Fiat Chrysler Partners With Enel And Engie
- Enel Chile Announces The Filing Of The 2018 Annual Report On Form 20-F
- Enel Américas Announces the Filing of the 2018 Annual Report on Form 20-F
About author

Online


Add a comment
Comments
0 comments on the analysis ENEL - Daily