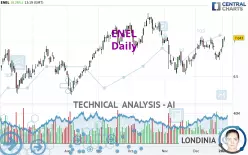
ENEL - Daily - Technical analysis published on 01/03/2025 (GMT)
- 260
- 0
Click here for a new analysis!
- Timeframe : Daily
- - Analysis generated on
- Status : INVALID

Summary of the analysis

Additional analysis
Quotes
ENEL rating 7.043 EUR. On the day, this instrument gained +0.26% with the lowest point at 6.996 EUR and the highest point at 7.066 EUR. The deviation from the price is +0.67% for the low point and -0.33% for the high point.A study of price movements over other periods shows the following variations:
Near a new HIGH record (5 years)
Type : Bullish
Timeframe : Weekly
Near a new HIGH record (1 year)
Type : Bullish
Timeframe : Weekly
Near a new LOW record (1st january)
Type : Bearish
Timeframe : Weekly
Near a new LOW record (1 month)
Type : Bearish
Timeframe : Weekly
Technical
A technical analysis in Daily of this ENEL chart shows a strongly bullish trend. The signals given by the moving averages are 82.14% bullish. This strong bullish trend is confirmed by the strong signals currently being given by short-term moving averages. The Central Indicators scanner does not detect any result on moving averages that would impact this trend.
An assessment of technical indicators shows a strong bullish signal.
Central Indicators, the scanner specialised in technical indicators, has identified this signal:
Pivot points : price is over resistance 3
Type : Neutral
Timeframe : Weekly
An analysis of the price chart with the Central Patterns scanner (detector of chart patterns and resistances and supports) shows several results that can have an impact on the price change:
Near resistance of channel
Type : Bearish
Timeframe : Daily
Near horizontal support
Type : Bullish
Timeframe : Daily
The Central Candlesticks scanner, specialised in Japanese candlesticks, did not identify any signals.
| S3 | S2 | S1 | Price | R1 | |
|---|---|---|---|---|---|
| ProTrendLines | 6.615 | 6.868 | 7.017 | 7.043 | 7.295 |
| Change (%) | -6.08% | -2.48% | -0.37% | - | +3.58% |
| Change | -0.428 | -0.175 | -0.026 | - | +0.252 |
| Level | Major | Intermediate | Intermediate | - | Major |
Pivot points can also be used to set your price objectives. Here is the price situation in relation to pivot points:
| Pivot points | S3 | S2 | S1 | PP | R1 | R2 | R3 |
|---|---|---|---|---|---|---|---|
| Standard | 6.808 | 6.852 | 6.938 | 6.982 | 7.068 | 7.112 | 7.198 |
| Camarilla | 6.989 | 7.001 | 7.013 | 7.025 | 7.037 | 7.049 | 7.061 |
| Woodie | 6.830 | 6.863 | 6.960 | 6.993 | 7.090 | 7.123 | 7.220 |
| Fibonacci | 6.852 | 6.901 | 6.932 | 6.982 | 7.031 | 7.062 | 7.112 |
| Pivot points | S3 | S2 | S1 | PP | R1 | R2 | R3 |
|---|---|---|---|---|---|---|---|
| Standard | 6.660 | 6.698 | 6.772 | 6.810 | 6.884 | 6.922 | 6.996 |
| Camarilla | 6.816 | 6.827 | 6.837 | 6.847 | 6.857 | 6.868 | 6.878 |
| Woodie | 6.679 | 6.707 | 6.791 | 6.819 | 6.903 | 6.931 | 7.015 |
| Fibonacci | 6.698 | 6.741 | 6.767 | 6.810 | 6.853 | 6.879 | 6.922 |
| Pivot points | S3 | S2 | S1 | PP | R1 | R2 | R3 |
|---|---|---|---|---|---|---|---|
| Standard | 6.387 | 6.559 | 6.722 | 6.894 | 7.057 | 7.229 | 7.392 |
| Camarilla | 6.794 | 6.825 | 6.855 | 6.886 | 6.917 | 6.947 | 6.978 |
| Woodie | 6.384 | 6.557 | 6.719 | 6.892 | 7.054 | 7.227 | 7.389 |
| Fibonacci | 6.559 | 6.687 | 6.766 | 6.894 | 7.022 | 7.101 | 7.229 |
Numerical data
The following is the status of the technical indicators and moving averages at the time of publication of this technical analysis:
| RSI (14): | 61.62 | |
| MACD (12,26,9): | 0.0230 | |
| Directional Movement: | 8.426 | |
| AROON (14): | 35.714 | |
| DEMA (21): | 6.926 | |
| Parabolic SAR (0,02-0,02-0,2): | 6.736 | |
| Elder Ray (13): | 0.109 | |
| Super Trend (3,10): | 6.734 | |
| Zig ZAG (10): | 7.052 | |
| VORTEX (21): | 1.0990 | |
| Stochastique (14,3,5): | 79.78 | |
| TEMA (21): | 6.961 | |
| Williams %R (14): | 0.00 | |
| Chande Momentum Oscillator (20): | 0.140 | |
| Repulse (5,40,3): | 3.3750 | |
| ROCnROLL: | 1 | |
| TRIX (15,9): | 0.0290 | |
| Courbe Coppock: | 0.07 |
| MA7: | 6.889 | |
| MA20: | 6.921 | |
| MA50: | 6.892 | |
| MA100: | 6.920 | |
| MAexp7: | 6.943 | |
| MAexp20: | 6.902 | |
| MAexp50: | 6.894 | |
| MAexp100: | 6.833 | |
| Price / MA7: | +2.24% | |
| Price / MA20: | +1.76% | |
| Price / MA50: | +2.19% | |
| Price / MA100: | +1.78% | |
| Price / MAexp7: | +1.44% | |
| Price / MAexp20: | +2.04% | |
| Price / MAexp50: | +2.16% | |
| Price / MAexp100: | +3.07% |
News
The last news published on ENEL at the time of the generation of this analysis was as follows:
- Universal EV Chargers Offers Seamless Migration Plan with Free Consultation for Former Enel X Way Customers
- HONEYWELL PARTNERS WITH ENEL NORTH AMERICA TO HELP STABILIZE POWER GRIDS THROUGH ENERGY MANAGEMENT AUTOMATION
- ENEL CHILE ANNOUNCES THE FILING OF THE 2023 ANNUAL REPORT ON FORM 20-F
- ENEL AND BXP EXECUTE POWER PURCHASE AGREEMENT FOR NEW TEXAS SOLAR PROJECT
- ENEL CHILE ANNOUNCES THE FILING OF THE 2022 ANNUAL REPORT ON FORM 20-F
About author
Online


Add a comment
Comments
0 comments on the analysis ENEL - Daily