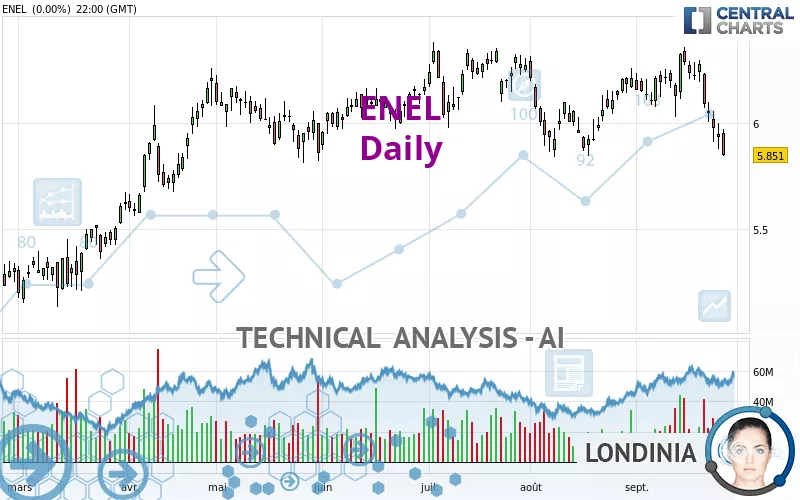
ENEL - Daily - Technical analysis published on 09/28/2023 (GMT)
- 249
- 0
Click here for a new analysis!
- Timeframe : Daily
- - Analysis generated on
- Status : LEVEL MAINTAINED

Summary of the analysis

Additional analysis
Quotes
The ENEL rating is 5.837 EUR. The price registered a decrease of -0.24% on the session with the lowest point at 5.793 EUR and the highest point at 5.894 EUR. The deviation from the price is +0.76% for the low point and -0.97% for the high point.The Central Gaps scanner detects a bullish opening marking the presence of buyers ahead of sellers at the opening but not sufficiently marked to allow the price to register a quotation gap.
Bullish opening
Type : Bullish
Timeframe : Openning
A study of price movements over other periods shows the following variations:
New LOW record (1 month)
Type : Bearish
Timeframe : Weekly
Technical
Technical analysis of ENEL in Daily shows an overall bearish trend. 71.43% of the signals given by moving averages are bearish. This bearish trend is supported by the strong bearish signals given by short-term moving averages. The Central Indicators scanner detects a bearish signal on moving averages that could impact this trend:
Bearish trend reversal : Moving Average 100
Type : Bearish
Timeframe : Daily
Technical indicators are bearish. There is still some doubt about the decline in the price.
But beware of excesses. The Central Indicators scanner currently detects this:
CCI indicator is oversold : under -100
Type : Neutral
Timeframe : Daily
Previous candle closed under Bollinger bands
Type : Neutral
Timeframe : Daily
Williams %R indicator is oversold : under -80
Type : Neutral
Timeframe : Daily
Pivot points : price is under support 1
Type : Neutral
Timeframe : Weekly
Central Patterns, the market scanner focusing on chart patterns, resistances and supports found this result:
Support of channel is broken
Type : Bearish
Timeframe : Daily
No result was found by the Central Candlesticks scanner on Japanese candlesticks.
| S3 | S2 | S1 | Price | R1 | R2 | R3 | |
|---|---|---|---|---|---|---|---|
| ProTrendLines | 4.702 | 5.036 | 5.431 | 5.837 | 5.947 | 6.132 | 6.312 |
| Change (%) | -19.44% | -13.72% | -6.96% | - | +1.88% | +5.05% | +8.14% |
| Change | -1.135 | -0.801 | -0.406 | - | +0.110 | +0.295 | +0.475 |
| Level | Minor | Intermediate | Intermediate | - | Major | Minor | Intermediate |
Attention could also be paid to pivot points to set price objectives:
| Pivot points | S3 | S2 | S1 | PP | R1 | R2 | R3 |
|---|---|---|---|---|---|---|---|
| Standard | 5.679 | 5.762 | 5.806 | 5.889 | 5.933 | 6.016 | 6.060 |
| Camarilla | 5.816 | 5.828 | 5.839 | 5.851 | 5.863 | 5.874 | 5.886 |
| Woodie | 5.661 | 5.752 | 5.788 | 5.879 | 5.915 | 6.006 | 6.042 |
| Fibonacci | 5.762 | 5.810 | 5.840 | 5.889 | 5.937 | 5.967 | 6.016 |
| Pivot points | S3 | S2 | S1 | PP | R1 | R2 | R3 |
|---|---|---|---|---|---|---|---|
| Standard | 5.643 | 5.824 | 5.934 | 6.115 | 6.225 | 6.406 | 6.516 |
| Camarilla | 5.965 | 5.992 | 6.018 | 6.045 | 6.072 | 6.098 | 6.125 |
| Woodie | 5.609 | 5.806 | 5.900 | 6.097 | 6.191 | 6.388 | 6.482 |
| Fibonacci | 5.824 | 5.935 | 6.004 | 6.115 | 6.226 | 6.295 | 6.406 |
| Pivot points | S3 | S2 | S1 | PP | R1 | R2 | R3 |
|---|---|---|---|---|---|---|---|
| Standard | 5.459 | 5.651 | 5.930 | 6.122 | 6.401 | 6.593 | 6.872 |
| Camarilla | 6.081 | 6.124 | 6.167 | 6.210 | 6.253 | 6.296 | 6.340 |
| Woodie | 5.504 | 5.673 | 5.975 | 6.144 | 6.446 | 6.615 | 6.917 |
| Fibonacci | 5.651 | 5.831 | 5.942 | 6.122 | 6.302 | 6.413 | 6.593 |
Numerical data
The following is the status of the technical indicators and moving averages at the time of publication of this technical analysis:
| RSI (14): | 33.61 | |
| MACD (12,26,9): | -0.0470 | |
| Directional Movement: | -19.728 | |
| AROON (14): | -64.286 | |
| DEMA (21): | 6.037 | |
| Parabolic SAR (0,02-0,02-0,2): | 6.234 | |
| Elder Ray (13): | -0.201 | |
| Super Trend (3,10): | 6.190 | |
| Zig ZAG (10): | 5.826 | |
| VORTEX (21): | 0.8300 | |
| Stochastique (14,3,5): | 7.45 | |
| TEMA (21): | 5.967 | |
| Williams %R (14): | -91.67 | |
| Chande Momentum Oscillator (20): | -0.359 | |
| Repulse (5,40,3): | -2.3610 | |
| ROCnROLL: | 2 | |
| TRIX (15,9): | 0.0120 | |
| Courbe Coppock: | 5.69 |
| MA7: | 6.002 | |
| MA20: | 6.129 | |
| MA50: | 6.104 | |
| MA100: | 5.997 | |
| MAexp7: | 5.971 | |
| MAexp20: | 6.077 | |
| MAexp50: | 6.070 | |
| MAexp100: | 5.946 | |
| Price / MA7: | -2.75% | |
| Price / MA20: | -4.76% | |
| Price / MA50: | -4.37% | |
| Price / MA100: | -2.67% | |
| Price / MAexp7: | -2.24% | |
| Price / MAexp20: | -3.95% | |
| Price / MAexp50: | -3.84% | |
| Price / MAexp100: | -1.83% |
News
The latest news and videos published on ENEL at the time of the analysis were as follows:
- ENEL AND BXP EXECUTE POWER PURCHASE AGREEMENT FOR NEW TEXAS SOLAR PROJECT
- ENEL CHILE ANNOUNCES THE FILING OF THE 2022 ANNUAL REPORT ON FORM 20-F
- GOGORO AND ENEL X ACCELERATE TAIWAN'S ENERGY TRANSITION WITH INTEGRATION OF VIRTUAL POWER PLANT AND 2,500 BATTERY SWAPPING STATIONS ACROSS 1,000+ LOCATIONS
- Louisville Gas and Electric Company and Kentucky Utilities Company Partner with Enel X Way to Increase Public Electric Vehicle Charging Access in Kentucky
- ENEL S.p.A. ANNOUNCES TENDER OFFERS
About author
Online


Add a comment
Comments
0 comments on the analysis ENEL - Daily