GRAYSCALE LITECOIN TRUST (LTC) LTCN - Daily - Technical analysis published on 04/16/2022 (GMT)
- 247
- 0
Click here for a new analysis!
- Timeframe : Daily
- - Analysis generated on
- Status : INVALID
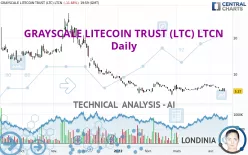

Summary of the analysis
Additional analysis
Quotes
The GRAYSCALE LITECOIN TRUST (LTC) LTCN price is 5.37 USD. The price is lower by -11.68% since the last closing with the lowest point at 5.26 USD and the highest point at 6.08 USD. The deviation from the price is +2.09% for the low point and -11.68% for the high point.Here is a more detailed summary of the historical variations registered by GRAYSCALE LITECOIN TRUST (LTC) LTCN:
New LOW record (1 month)
Type : Bearish
Timeframe : Weekly
Technical
Technical analysis of this Daily chart of GRAYSCALE LITECOIN TRUST (LTC) LTCN indicates that the overall trend is strongly bearish. The signals given by moving averages are 89.29% bearish. This strong bearish trend is confirmed by the strong signals currently being given by short-term moving averages. The Central Indicators market scanner currently does not detect any result that concerns moving averages.
In fact, according to the parameters integrated into the Central Analyzer system, 13 technical indicators out of 18 analysed are currently bearish. But beware of excesses. The Central Indicators scanner currently detects this:
CCI indicator is oversold : under -100
Type : Neutral
Timeframe : Daily
Williams %R indicator is oversold : under -80
Type : Neutral
Timeframe : Daily
Pivot points : price is under support 1
Type : Neutral
Timeframe : Daily
Pivot points : price is under support 3
Type : Neutral
Timeframe : Weekly
Ichimoku : price is under the cloud
Type : Bearish
Timeframe : Daily
Central Patterns, the scanner specializing in chart patterns, did not identify any signals.
The Central Candlesticks scanner which studies Japanese candlesticks did not detect anything.
| S1 | Price | R1 | R2 | R3 | |
|---|---|---|---|---|---|
| ProTrendLines | 5.28 | 5.37 | 7.17 | 13.18 | 17.65 |
| Change (%) | -1.68% | - | +33.52% | +145.44% | +228.68% |
| Change | -0.09 | - | +1.80 | +7.81 | +12.28 |
| Level | Major | - | Minor | Intermediate | Minor |
To determine price objectives, it is also possible to use the pivot points. Here is the price position in relation to pivot points:
| Pivot points | S3 | S2 | S1 | PP | R1 | R2 | R3 |
|---|---|---|---|---|---|---|---|
| Standard | 4.24 | 4.75 | 5.06 | 5.57 | 5.88 | 6.39 | 6.70 |
| Camarilla | 5.15 | 5.22 | 5.30 | 5.37 | 5.45 | 5.52 | 5.60 |
| Woodie | 4.14 | 4.70 | 4.96 | 5.52 | 5.78 | 6.34 | 6.60 |
| Fibonacci | 4.75 | 5.06 | 5.26 | 5.57 | 5.88 | 6.08 | 6.39 |
| Pivot points | S3 | S2 | S1 | PP | R1 | R2 | R3 |
|---|---|---|---|---|---|---|---|
| Standard | 4.72 | 5.40 | 5.80 | 6.48 | 6.88 | 7.56 | 7.96 |
| Camarilla | 5.89 | 5.99 | 6.09 | 6.19 | 6.29 | 6.39 | 6.49 |
| Woodie | 4.57 | 5.33 | 5.65 | 6.41 | 6.73 | 7.49 | 7.81 |
| Fibonacci | 5.40 | 5.82 | 6.07 | 6.48 | 6.90 | 7.15 | 7.56 |
| Pivot points | S3 | S2 | S1 | PP | R1 | R2 | R3 |
|---|---|---|---|---|---|---|---|
| Standard | 3.16 | 4.14 | 5.42 | 6.40 | 7.68 | 8.66 | 9.94 |
| Camarilla | 6.08 | 6.29 | 6.49 | 6.70 | 6.91 | 7.11 | 7.32 |
| Woodie | 3.31 | 4.22 | 5.57 | 6.48 | 7.83 | 8.74 | 10.09 |
| Fibonacci | 4.14 | 5.00 | 5.54 | 6.40 | 7.26 | 7.80 | 8.66 |
Numerical data
The following is the status of technical indicators and moving averages registered at the time this technical analysis was created:
| RSI (14): | 39.65 | |
| MACD (12,26,9): | -0.1600 | |
| Directional Movement: | -9.56 | |
| AROON (14): | -92.86 | |
| DEMA (21): | 6.05 | |
| Parabolic SAR (0,02-0,02-0,2): | 6.89 | |
| Elder Ray (13): | -0.44 | |
| Super Trend (3,10): | 6.90 | |
| Zig ZAG (10): | 5.37 | |
| VORTEX (21): | 0.9500 | |
| Stochastique (14,3,5): | 14.67 | |
| TEMA (21): | 6.00 | |
| Williams %R (14): | -94.81 | |
| Chande Momentum Oscillator (20): | -1.64 | |
| Repulse (5,40,3): | -12.5100 | |
| ROCnROLL: | 2 | |
| TRIX (15,9): | 0.0700 | |
| Courbe Coppock: | 15.75 |
| MA7: | 5.90 | |
| MA20: | 6.40 | |
| MA50: | 6.27 | |
| MA100: | 8.37 | |
| MAexp7: | 5.88 | |
| MAexp20: | 6.20 | |
| MAexp50: | 6.80 | |
| MAexp100: | 14.57 | |
| Price / MA7: | -8.98% | |
| Price / MA20: | -16.09% | |
| Price / MA50: | -14.35% | |
| Price / MA100: | -35.84% | |
| Price / MAexp7: | -8.67% | |
| Price / MAexp20: | -13.39% | |
| Price / MAexp50: | -21.03% | |
| Price / MAexp100: | -63.14% |
About author

Online


Add a comment
Comments
0 comments on the analysis GRAYSCALE LITECOIN TRUST (LTC) LTCN - Daily