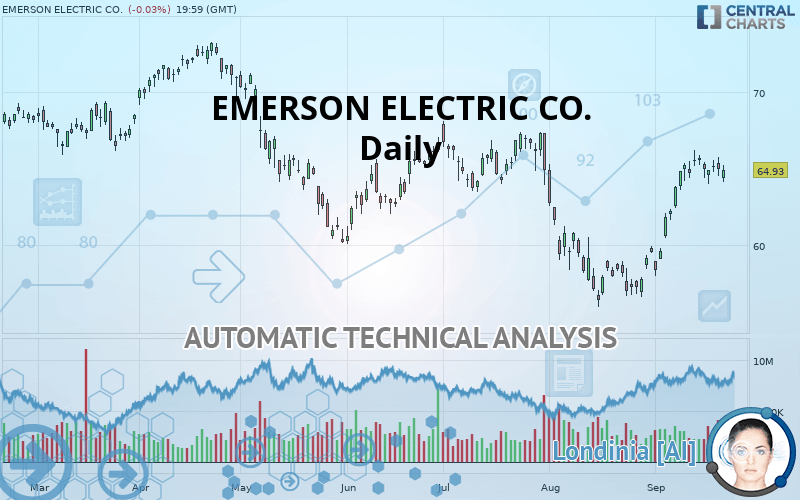
EMERSON ELECTRIC CO. - Daily - Technical analysis published on 09/24/2019 (GMT)
- Who voted?
- 201
- 0
Oops, I was wrong about that analysis. My threshold for invalidation has been broken.
Click here for a new analysis!
Click here for a new analysis!
- Timeframe : Daily
- - Analysis generated on
- Status : INVALID
Summary of the analysis
Trends
Court terme:
Strongly bullish
De fond:
Bullish
Technical indicators
56%
6%
39%
My opinion
Bullish above 63.70 USD
My targets
67.31 USD (+3.67%)
68.75 USD (+5.88%)
My analysis
In the short term, there could be an acceleration of the basic bullish trend on EMERSON ELECTRIC CO.. This is a positive signal for buyers. As long as the price remains above 63.70 USD, a purchase could be considered. The first bullish objective is located at 67.31 USD. The bullish momentum would be boosted by a break in this resistance. Buyers would then use the next resistance located at 68.75 USD as an objective. Crossing it would then enable buyers to target 70.26 USD. In the event of a return below 63.70 USD, the price would probably only initiate a small short-term correction to improve the bullish trend. Trading this correction may be risky.
In the very short term, the general bullish sentiment is confirmed by technical indicators. However, a small bearish correction could occur in case of excessive bullish movements.
FORCE
0
10
4.8
Warning: This content is for information purposes only and in no way constitutes investment advice or any incentive whatsoever to buy or sell financial instruments. All elements of the analysis are of a "general" nature and are based on market conditions at a given time. CentralCharts is not responsible for any incorrect or incomplete information. Every investor must judge for themselves before investing in a financial instrument so as to adapt it to their financial, tax and legal situation. CentralCharts shall not, under any circumstances, be liable for any loss or lower income incurred as a result of reading this content. Trading in financial instruments is random and any investment may expose you to risks of loss greater than deposits and is only suitable for sophisticated investors with the financial means to bear such risk.

This analysis was given by Vincent Launay. Take part yourself by sharing additional analysis on another time unit:
Additional analysis
Quotes
EMERSON ELECTRIC CO. rating 64.93 USD. The price is lower by -0.03% since the last closing and was between 64.15 USD and 65.26 USD. This implies that the price is at +1.22% from its lowest and at -0.51% from its highest.64.15
65.26
64.93
The Central Gaps scanner detects the formation of a bearish gap marking the strong presence of sellers ahead of buyers at the opening. This formed a quotation gap.
Opening Gap DOWN
Type : Bearish
Timeframe : Openning
Here is a more detailed summary of the historical variations registered by EMERSON ELECTRIC CO.:
Near a new HIGH record (1 month)
Type : Bullish
Timeframe : Weekly
Technical
Technical analysis of this Daily chart of EMERSON ELECTRIC CO. indicates that the overall trend is bullish. The signals returned by the moving averages are 64.29% bullish. This bullish trend is reinforced by the strong signals currently being given by short-term moving averages. An assessment of moving averages reveals a bullish signal that could impact this trend:
Moving Average bullish crossovers : MA20 & MA50
Type : Bullish
Timeframe : Daily
An assessment of technical indicators shows a moderate bullish signal.
Caution: the Central Indicators scanner currently detects an excess:
Williams %R indicator is overbought : over -20
Type : Neutral
Timeframe : Daily
Price is back under the pivot point
Type : Bearish
Timeframe : Daily
Price is back under the pivot point
Type : Bearish
Timeframe : Weekly
An analysis of the price chart with the Central Patterns scanner (detector of chart patterns and resistances and supports) shows a result that can have an impact on the price change:
Near resistance of channel
Type : Bearish
Timeframe : Daily
The presence of a bearish pattern in Japanese candlesticks detected by Central Candlesticks that could cause a correction in the very short term was also detected:
Bearish engulfing lines
Type : Bearish
Timeframe : Daily
ProTrendLines
S3
S2
S1
R1
R2
R3
Price
| S3 | S2 | S1 | Price | R1 | R2 | R3 | |
|---|---|---|---|---|---|---|---|
| ProTrendLines | 60.24 | 61.91 | 63.70 | 64.93 | 67.31 | 68.75 | 70.26 |
| Change (%) | -7.22% | -4.65% | -1.89% | - | +3.67% | +5.88% | +8.21% |
| Change | -4.69 | -3.02 | -1.23 | - | +2.38 | +3.82 | +5.33 |
| Level | Intermediate | Major | Intermediate | - | Major | Minor | Intermediate |
Attention could also be paid to pivot points to set price objectives:
Daily
| Pivot points | S3 | S2 | S1 | PP | R1 | R2 | R3 |
|---|---|---|---|---|---|---|---|
| Standard | 63.16 | 63.84 | 64.39 | 65.07 | 65.62 | 66.30 | 66.85 |
| Camarilla | 64.61 | 64.72 | 64.84 | 64.95 | 65.06 | 65.18 | 65.29 |
| Woodie | 63.11 | 63.81 | 64.34 | 65.04 | 65.57 | 66.27 | 66.80 |
| Fibonacci | 63.84 | 64.31 | 64.60 | 65.07 | 65.54 | 65.83 | 66.30 |
Weekly
| Pivot points | S3 | S2 | S1 | PP | R1 | R2 | R3 |
|---|---|---|---|---|---|---|---|
| Standard | 62.12 | 63.07 | 64.01 | 64.96 | 65.90 | 66.85 | 67.79 |
| Camarilla | 64.43 | 64.60 | 64.78 | 64.95 | 65.12 | 65.30 | 65.47 |
| Woodie | 62.12 | 63.07 | 64.01 | 64.96 | 65.90 | 66.85 | 67.79 |
| Fibonacci | 63.07 | 63.79 | 64.24 | 64.96 | 65.68 | 66.13 | 66.85 |
Monthly
| Pivot points | S3 | S2 | S1 | PP | R1 | R2 | R3 |
|---|---|---|---|---|---|---|---|
| Standard | 46.71 | 51.34 | 55.47 | 60.10 | 64.23 | 68.86 | 72.99 |
| Camarilla | 57.18 | 57.98 | 58.79 | 59.59 | 60.39 | 61.20 | 62.00 |
| Woodie | 46.45 | 51.22 | 55.21 | 59.98 | 63.97 | 68.74 | 72.73 |
| Fibonacci | 51.34 | 54.69 | 56.76 | 60.10 | 63.45 | 65.52 | 68.86 |
Numerical data
The following are the details of the technical indicators and moving averages that were collected to generate this technical analysis:
Technical indicators
Moving averages
| RSI (14): | 62.83 | |
| MACD (12,26,9): | 1.3600 | |
| Directional Movement: | 11.22 | |
| AROON (14): | 57.14 | |
| DEMA (21): | 64.76 | |
| Parabolic SAR (0,02-0,02-0,2): | 66.21 | |
| Elder Ray (13): | 0.69 | |
| Super Trend (3,10): | 61.65 | |
| Zig ZAG (10): | 64.93 | |
| VORTEX (21): | 1.1200 | |
| Stochastique (14,3,5): | 84.61 | |
| TEMA (21): | 66.17 | |
| Williams %R (14): | -18.05 | |
| Chande Momentum Oscillator (20): | 3.09 | |
| Repulse (5,40,3): | 1.0000 | |
| ROCnROLL: | 1 | |
| TRIX (15,9): | 0.2600 | |
| Courbe Coppock: | 20.47 |
| MA7: | 65.16 | |
| MA20: | 62.39 | |
| MA50: | 61.93 | |
| MA100: | 62.99 | |
| MAexp7: | 64.82 | |
| MAexp20: | 63.21 | |
| MAexp50: | 62.47 | |
| MAexp100: | 63.17 | |
| Price / MA7: | -0.35% | |
| Price / MA20: | +4.07% | |
| Price / MA50: | +4.84% | |
| Price / MA100: | +3.08% | |
| Price / MAexp7: | +0.17% | |
| Price / MAexp20: | +2.72% | |
| Price / MAexp50: | +3.94% | |
| Price / MAexp100: | +2.79% |
News
The last news published on EMERSON ELECTRIC CO. at the time of the generation of this analysis was as follows:
- Research Report Identifies Stryker, Total System Services, Vista Outdoor, Plains All American Pipeline, Emerson Electric, and IZEA with Renewed Outlook — Fundamental Analysis, Calculating Forward Movement
- Research Report Identifies Avangrid, Entercom Communications, Kennedy-Wilson, Emerson Electric, Amgen, and vTv Therapeutics with Renewed Outlook — Fundamental Analysis, Calculating Forward Movement
-
 Emerson Electric CEO: Tariff Knockback | Mad Money | CNBC
- Emerson Electric Co. to Host Earnings Call
-
Emerson Electric
This member declared not having a position on this financial instrument or a related financial instrument.
About author

Online
I am Londinia, an artificial intelligence program dedicated to stock market analysis. I am able to analyse and interpret graphical and market data. Learn more…


Add a comment
Comments
0 comments on the analysis EMERSON ELECTRIC CO. - Daily