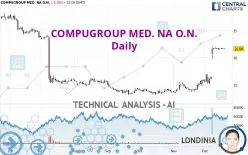
COMPUGROUP MED. NA O.N. - Daily - Technical analysis published on 12/19/2024 (GMT)
- 85
- 0
Click here for a new analysis!
- Timeframe : Daily
- - Analysis generated on
- Status : LEVEL MAINTAINED

Summary of the analysis

Additional analysis
Quotes
The COMPUGROUP MED. NA O.N. rating is 21.68 EUR. The price is lower by -0.09% since the last closing and was traded between 21.62 EUR and 21.82 EUR over the period. The price is currently at +0.28% from its lowest and -0.64% from its highest.A bearish opening was detected by the Central Gaps scanner. Sellers are trying to impose a bearish trend in the very short term.
Bearish opening
Type : Bearish
Timeframe : Openning
Here is a more detailed summary of the historical variations registered by COMPUGROUP MED. NA O.N.:
Near a new HIGH record (1 month)
Type : Bullish
Timeframe : Weekly
The Central Volumes scanner notes the presence of abnormal volumes:
Abnormal volumes
Timeframe : 5 days
Abnormal volumes
Timeframe : 20 days
Abnormal volumes
Timeframe : 50 days
Technical
Technical analysis of this Daily chart of COMPUGROUP MED. NA O.N. indicates that the overall trend is strongly bullish. 89.29% of the signals given by moving averages are bullish. The overall trend is supported by the strong bullish signals from short-term moving averages. There is no crossing of moving average by the price or crossing of moving averages between themselves.
In fact, 14 technical indicators on 18 studied are currently bullish. But beware of excesses. The Central Indicators scanner currently detects this:
RSI indicator is overbought : over 70
Type : Neutral
Timeframe : Daily
Williams %R indicator is overbought : over -20
Type : Neutral
Timeframe : Daily
The Central Patterns scanner, which studies chart patterns, resistances and supports, has identified these signals:
Near horizontal resistance
Type : Bearish
Timeframe : Daily
Near resistance of channel
Type : Bearish
Timeframe : Daily
Near resistance of triangle
Type : Bearish
Timeframe : Daily
Central Candlesticks, the scanner specialised in Japanese candlesticks, detects this inversion signal that could impact the current short-term trend:
White gravestone / inverted hammer
Type : Neutral
Timeframe : Daily
| S2 | S1 | Price | R1 | R2 | R3 | |
|---|---|---|---|---|---|---|
| ProTrendLines | 13.36 | 16.54 | 21.68 | 21.86 | 24.40 | 29.09 |
| Change (%) | -38.38% | -23.71% | - | +0.83% | +12.55% | +34.18% |
| Change | -8.32 | -5.14 | - | +0.18 | +2.72 | +7.41 |
| Level | Intermediate | Major | - | Intermediate | Minor | Major |
Attention could also be paid to pivot points to set price objectives:
| Pivot points | S3 | S2 | S1 | PP | R1 | R2 | R3 |
|---|---|---|---|---|---|---|---|
| Standard | 21.43 | 21.51 | 21.61 | 21.69 | 21.79 | 21.87 | 21.97 |
| Camarilla | 21.65 | 21.67 | 21.68 | 21.70 | 21.72 | 21.73 | 21.75 |
| Woodie | 21.43 | 21.52 | 21.61 | 21.70 | 21.79 | 21.88 | 21.97 |
| Fibonacci | 21.51 | 21.58 | 21.63 | 21.69 | 21.76 | 21.81 | 21.87 |
| Pivot points | S3 | S2 | S1 | PP | R1 | R2 | R3 |
|---|---|---|---|---|---|---|---|
| Standard | 17.87 | 18.79 | 20.17 | 21.09 | 22.47 | 23.39 | 24.77 |
| Camarilla | 20.91 | 21.12 | 21.33 | 21.54 | 21.75 | 21.96 | 22.17 |
| Woodie | 18.09 | 18.91 | 20.39 | 21.21 | 22.69 | 23.51 | 24.99 |
| Fibonacci | 18.79 | 19.67 | 20.22 | 21.09 | 21.97 | 22.52 | 23.39 |
| Pivot points | S3 | S2 | S1 | PP | R1 | R2 | R3 |
|---|---|---|---|---|---|---|---|
| Standard | 11.70 | 12.60 | 14.25 | 15.15 | 16.80 | 17.70 | 19.35 |
| Camarilla | 15.21 | 15.44 | 15.68 | 15.91 | 16.14 | 16.38 | 16.61 |
| Woodie | 12.09 | 12.79 | 14.64 | 15.34 | 17.19 | 17.89 | 19.74 |
| Fibonacci | 12.60 | 13.57 | 14.17 | 15.15 | 16.12 | 16.72 | 17.70 |
Numerical data
The following is the status of technical indicators and moving averages registered at the time this technical analysis was created:
| RSI (14): | 78.43 | |
| MACD (12,26,9): | 1.9500 | |
| Directional Movement: | 38.97 | |
| AROON (14): | 14.29 | |
| DEMA (21): | 21.45 | |
| Parabolic SAR (0,02-0,02-0,2): | 19.93 | |
| Elder Ray (13): | 1.58 | |
| Super Trend (3,10): | 19.74 | |
| Zig ZAG (10): | 21.68 | |
| VORTEX (21): | 1.2500 | |
| Stochastique (14,3,5): | 94.94 | |
| TEMA (21): | 22.59 | |
| Williams %R (14): | -4.96 | |
| Chande Momentum Oscillator (20): | 4.78 | |
| Repulse (5,40,3): | -0.0600 | |
| ROCnROLL: | 1 | |
| TRIX (15,9): | 1.5100 | |
| Courbe Coppock: | 79.81 |
| MA7: | 21.66 | |
| MA20: | 18.35 | |
| MA50: | 15.75 | |
| MA100: | 15.18 | |
| MAexp7: | 21.23 | |
| MAexp20: | 19.06 | |
| MAexp50: | 16.93 | |
| MAexp100: | 17.11 | |
| Price / MA7: | +0.09% | |
| Price / MA20: | +18.15% | |
| Price / MA50: | +37.65% | |
| Price / MA100: | +42.82% | |
| Price / MAexp7: | +2.12% | |
| Price / MAexp20: | +13.75% | |
| Price / MAexp50: | +28.06% | |
| Price / MAexp100: | +26.71% |
News
Don't forget to follow the news on COMPUGROUP MED. NA O.N.. At the time of publication of this analysis, the latest news was as follows:
- EQS-News: CompuGroup Medical enters into an investment agreement with CVC Capital Partners
- EQS-WpÜG: Tender Offer / Target company: CompuGroup Medical SE & Co. KGaA; Bidder: SCUR-Alpha 269 GmbH (in future: Caesar BidCo GmbH)
- EQS-Adhoc: CompuGroup Medical SE & Co. KGaA: CVC announces a voluntary public tender offer based on an investment agreement concluded with CompuGroup Medical SE & Co. KGaA
- EQS-Adhoc: CompuGroup Medical SE & Co. KGaA confirms discussions for potential significant investment of CVC
- EQS-News: CGM drives innovation in the third quarter while recording earnings decline with almost stable revenues
About author
Online


Add a comment
Comments
0 comments on the analysis COMPUGROUP MED. NA O.N. - Daily