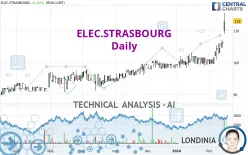
ELEC.STRASBOURG - Daily - Technical analysis published on 02/15/2024 (GMT)
- 126
- 0
- Timeframe : Daily
- - Analysis generated on
- Status : WITHOUT TARGET

Summary of the analysis

Additional analysis
Quotes
The ELEC.STRASBOURG rating is 113.0 EUR. On the day, this instrument gained +6.60% and was traded between 109.0 EUR and 115.5 EUR over the period. The price is currently at +3.67% from its lowest and -2.16% from its highest.A bullish gap was detected at the opening by the Central Gaps scanner. There are a lot of buyers and they have the upper hand in the very short term.
Opening Gap UP
Type : Bullish
Timeframe : Openning
A study of price movements over other periods shows the following variations:
New HIGH record (5 years)
Type : Bullish
Timeframe : Weekly
New HIGH record (1 year)
Type : Bullish
Timeframe : Weekly
New HIGH record (1st january)
Type : Bullish
Timeframe : Weekly
New HIGH record (1 month)
Type : Bullish
Timeframe : Weekly
Technical
Technical analysis of this Daily chart of ELEC.STRASBOURG indicates that the overall trend is strongly bullish. 92.86% of the signals given by moving averages are bullish. This strongly bullish trend is supported by the strong bullish signals given by short-term moving averages. The Central Indicators scanner does not detect any result on moving averages that would impact this trend.
In fact, 15 technical indicators on 18 studied are currently bullish. Caution: the Central Indicators scanner currently detects an excess:
RSI indicator is overbought : over 70
Type : Neutral
Timeframe : Daily
CCI indicator is overbought : over 100
Type : Neutral
Timeframe : Daily
Williams %R indicator is overbought : over -20
Type : Neutral
Timeframe : Daily
Pivot points : price is over resistance 3
Type : Neutral
Timeframe : Daily
Pivot points : price is over resistance 3
Type : Neutral
Timeframe : Weekly
Central Patterns, the market scanner focusing on chart patterns, resistances and supports found this result:
Resistance of channel is broken
Type : Bullish
Timeframe : Daily
The presence of a bullish Japanese candlestick pattern detected by Central Candlesticks that could cause a very short term rebound was also detected:
Upside gap
Type : Bullish
Timeframe : Daily
| S3 | S2 | S1 | Price | |
|---|---|---|---|---|
| ProTrendLines | 100.7 | 103.0 | 107.3 | 113.0 |
| Change (%) | -10.88% | -8.85% | -5.04% | - |
| Change | -12.3 | -10.0 | -5.7 | - |
| Level | Intermediate | Minor | Major | - |
Attention could also be paid to pivot points to set price objectives:
| Pivot points | S3 | S2 | S1 | PP | R1 | R2 | R3 |
|---|---|---|---|---|---|---|---|
| Standard | 103.2 | 103.8 | 105.2 | 105.8 | 107.2 | 107.8 | 109.2 |
| Camarilla | 106.0 | 106.1 | 106.3 | 106.5 | 106.7 | 106.9 | 107.1 |
| Woodie | 103.5 | 104.0 | 105.5 | 106.0 | 107.5 | 108.0 | 109.5 |
| Fibonacci | 103.8 | 104.6 | 105.1 | 105.8 | 106.6 | 107.1 | 107.8 |
| Pivot points | S3 | S2 | S1 | PP | R1 | R2 | R3 |
|---|---|---|---|---|---|---|---|
| Standard | 94.7 | 97.1 | 101.1 | 103.5 | 107.5 | 109.9 | 113.9 |
| Camarilla | 103.2 | 103.8 | 104.4 | 105.0 | 105.6 | 106.2 | 106.8 |
| Woodie | 95.4 | 97.5 | 101.8 | 103.9 | 108.2 | 110.3 | 114.6 |
| Fibonacci | 97.1 | 99.6 | 101.1 | 103.5 | 106.0 | 107.5 | 109.9 |
| Pivot points | S3 | S2 | S1 | PP | R1 | R2 | R3 |
|---|---|---|---|---|---|---|---|
| Standard | 93.3 | 95.8 | 98.1 | 100.6 | 102.9 | 105.4 | 107.7 |
| Camarilla | 99.2 | 99.6 | 100.1 | 100.5 | 100.9 | 101.4 | 101.8 |
| Woodie | 93.3 | 95.8 | 98.1 | 100.6 | 102.9 | 105.4 | 107.7 |
| Fibonacci | 95.8 | 97.6 | 98.7 | 100.6 | 102.4 | 103.5 | 105.4 |
Numerical data
The following are the details of the technical indicators and moving averages that were collected to generate this technical analysis:
| RSI (14): | 82.10 | |
| MACD (12,26,9): | 2.2000 | |
| Directional Movement: | 34.6 | |
| AROON (14): | 92.9 | |
| DEMA (21): | 106.1 | |
| Parabolic SAR (0,02-0,02-0,2): | 101.2 | |
| Elder Ray (13): | 7.3 | |
| Super Trend (3,10): | 103.3 | |
| Zig ZAG (10): | 115.0 | |
| VORTEX (21): | 1.1000 | |
| Stochastique (14,3,5): | 84.50 | |
| TEMA (21): | 107.1 | |
| Williams %R (14): | -15.20 | |
| Chande Momentum Oscillator (20): | 13.6 | |
| Repulse (5,40,3): | 4.0000 | |
| ROCnROLL: | 1 | |
| TRIX (15,9): | 0.1000 | |
| Courbe Coppock: | 10.10 |
| MA7: | 106.0 | |
| MA20: | 102.6 | |
| MA50: | 100.9 | |
| MA100: | 98.4 | |
| MAexp7: | 106.5 | |
| MAexp20: | 103.7 | |
| MAexp50: | 101.3 | |
| MAexp100: | 99.0 | |
| Price / MA7: | +6.60% | |
| Price / MA20: | +10.14% | |
| Price / MA50: | +11.99% | |
| Price / MA100: | +14.84% | |
| Price / MAexp7: | +6.10% | |
| Price / MAexp20: | +8.97% | |
| Price / MAexp50: | +11.55% | |
| Price / MAexp100: | +14.14% |
About author
Online


Add a comment
Comments
0 comments on the analysis ELEC.STRASBOURG - Daily