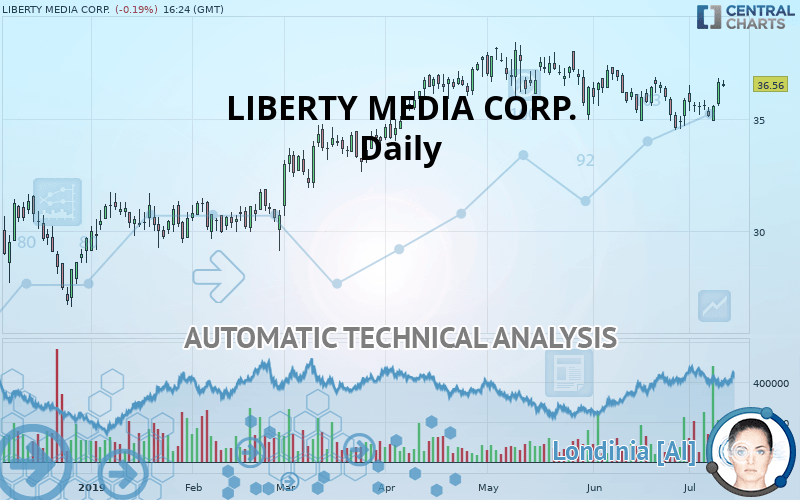
LIBERTY MEDIA CORP. - Daily - Technical analysis published on 07/11/2019 (GMT)
- Who voted?
- 335
- 0
Click here for a new analysis!
- Timeframe : Daily
- - Analysis generated on
- Status : TARGET REACHED

Summary of the analysis

Additional analysis
Quotes
The LIBERTY MEDIA CORP. price is 36.56 USD. On the day, this instrument lost -0.19% and was traded between 36.44 USD and 36.72 USD over the period. The price is currently at +0.33% from its lowest and -0.44% from its highest.A bearish opening was detected by the Central Gaps scanner. Sellers are trying to impose a bearish trend in the very short term.
Bearish opening
Type : Bearish
Timeframe : Openning
So that you have an overall view of the price change, here is a table showing the variations over several periods:
Near a new HIGH record (1 year)
Type : Bullish
Timeframe : Weekly
Near a new HIGH record (1st january)
Type : Bullish
Timeframe : Weekly
Near a new HIGH record (1 month)
Type : Bullish
Timeframe : Weekly
Technical
A technical analysis in Daily of this LIBERTY MEDIA CORP. chart shows a bullish trend. 78.57% of the signals given by moving averages are bullish. The overall trend is reinforced by the strong bullish signals from short-term moving averages. An assessment of moving averages reveals several bullish signals that could impact this trend:
Bullish trend reversal : Moving Average 20
Type : Bullish
Timeframe : Daily
Bullish trend reversal : adaptative moving average 20
Type : Bullish
Timeframe : Daily
Bullish trend reversal : adaptative moving average 50
Type : Bullish
Timeframe : Daily
Bullish price crossover with Moving Average 20
Type : Bullish
Timeframe : Daily
Bullish price crossover with Moving Average 50
Type : Bullish
Timeframe : Daily
Bullish price crossover with adaptative moving average 20
Type : Bullish
Timeframe : Daily
Bullish price crossover with adaptative moving average 50
Type : Bullish
Timeframe : Daily
In fact, 13 technical indicators on 18 studied are currently positioned bullish. Caution: the Central Indicators scanner currently detects an excess:
CCI indicator is overbought : over 100
Type : Neutral
Timeframe : Daily
Williams %R indicator is overbought : over -20
Type : Neutral
Timeframe : Daily
Pivot points : price is over resistance 1
Type : Neutral
Timeframe : Weekly
RSI indicator is back over 50
Type : Bullish
Timeframe : Daily
Parabolic SAR indicator bullish reversal
Type : Bullish
Timeframe : Daily
Ichimoku : price is over the cloud
Type : Bullish
Timeframe : Daily
Price is back over the pivot point
Type : Bullish
Timeframe : Daily
Price is back under the pivot point
Type : Bearish
Timeframe : Weekly
Momentum indicator is back over 0
Type : Bullish
Timeframe : Daily
Williams %R indicator is back over -50
Type : Bullish
Timeframe : Daily
An analysis of the price chart with the Central Patterns scanner (detector of chart patterns and resistances and supports) shows several results that can have an impact on the price change:
Resistance of channel is broken
Type : Bullish
Timeframe : Daily
Resistance of triangle is broken
Type : Bullish
Timeframe : Daily
The Central Candlesticks scanner, specialised in Japanese candlesticks, did not identify any signals.
| S3 | S2 | S1 | Price | R1 | R2 | R3 | |
|---|---|---|---|---|---|---|---|
| ProTrendLines | 31.27 | 32.51 | 35.38 | 36.56 | 37.07 | 38.11 | 39.00 |
| Change (%) | -14.47% | -11.08% | -3.23% | - | +1.39% | +4.24% | +6.67% |
| Change | -5.29 | -4.05 | -1.18 | - | +0.51 | +1.55 | +2.44 |
| Level | Major | Intermediate | Intermediate | - | Major | Major | Minor |
Pivot points can also be used to set your price objectives. Here is the price situation in relation to pivot points:
| Pivot points | S3 | S2 | S1 | PP | R1 | R2 | R3 |
|---|---|---|---|---|---|---|---|
| Standard | 34.62 | 35.10 | 35.87 | 36.35 | 37.12 | 37.60 | 38.37 |
| Camarilla | 36.29 | 36.40 | 36.52 | 36.63 | 36.75 | 36.86 | 36.97 |
| Woodie | 34.76 | 35.17 | 36.01 | 36.42 | 37.26 | 37.67 | 38.51 |
| Fibonacci | 35.10 | 35.58 | 35.88 | 36.35 | 36.83 | 37.13 | 37.60 |
| Pivot points | S3 | S2 | S1 | PP | R1 | R2 | R3 |
|---|---|---|---|---|---|---|---|
| Standard | 33.69 | 34.43 | 35.02 | 35.76 | 36.35 | 37.09 | 37.68 |
| Camarilla | 35.23 | 35.36 | 35.48 | 35.60 | 35.72 | 35.84 | 35.97 |
| Woodie | 33.61 | 34.39 | 34.94 | 35.72 | 36.27 | 37.05 | 37.60 |
| Fibonacci | 34.43 | 34.94 | 35.26 | 35.76 | 36.27 | 36.59 | 37.09 |
Numerical data
The following is the status of the technical indicators and moving averages at the time of publication of this technical analysis:
| RSI (14): | 55.60 | |
| MACD (12,26,9): | -0.1000 | |
| Directional Movement: | 3.91 | |
| AROON (14): | -28.57 | |
| DEMA (21): | 35.73 | |
| Parabolic SAR (0,02-0,02-0,2): | 34.56 | |
| Elder Ray (13): | 0.70 | |
| Super Trend (3,10): | 37.28 | |
| Zig ZAG (10): | 36.61 | |
| VORTEX (21): | 1.0000 | |
| Stochastique (14,3,5): | 74.79 | |
| TEMA (21): | 35.76 | |
| Williams %R (14): | -10.09 | |
| Chande Momentum Oscillator (20): | 0.62 | |
| Repulse (5,40,3): | 3.2700 | |
| ROCnROLL: | 1 | |
| TRIX (15,9): | -0.1000 | |
| Courbe Coppock: | 0.97 |
| MA7: | 35.81 | |
| MA20: | 35.79 | |
| MA50: | 36.49 | |
| MA100: | 35.37 | |
| MAexp7: | 35.99 | |
| MAexp20: | 35.92 | |
| MAexp50: | 35.96 | |
| MAexp100: | 35.26 | |
| Price / MA7: | +2.09% | |
| Price / MA20: | +2.15% | |
| Price / MA50: | +0.19% | |
| Price / MA100: | +3.36% | |
| Price / MAexp7: | +1.58% | |
| Price / MAexp20: | +1.78% | |
| Price / MAexp50: | +1.67% | |
| Price / MAexp100: | +3.69% |
About author

Online


Add a comment
Comments
0 comments on the analysis LIBERTY MEDIA CORP. - Daily