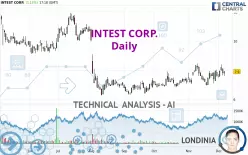
INTEST CORP. - Daily - Technical analysis published on 12/06/2024 (GMT)
- 117
- 0
Oops, I was wrong about that analysis. My threshold for invalidation has been broken.
Click here for a new analysis!
Click here for a new analysis!
- Timeframe : Daily
- - Analysis generated on
- Status : INVALID

Summary of the analysis
Trends
Short term:
Bullish
Underlying:
Slightly bullish
Technical indicators
78%
0%
22%
My opinion
Bullish above 7.66 USD
My targets
8.33 USD (+5.44%)
9.22 USD (+16.71%)
My analysis
The bullish trend is truly tentative and does not seem to be supported in the short term. It is advisable to trade INTEST CORP. with the greatest caution, while favouring long positions (at the time of purchase) as long as the price remains well above 7.66 USD. The buyers' bullish objective is set at 8.33 USD. A bullish break in this resistance would boost the bullish momentum. The buyers could then target the resistance located at 9.22 USD. If there is any crossing, the next objective would be the resistance located at 9.90 USD. If there is a bearish break in the support located at 7.66 USD some indecision would arise.
In the very short term, the general bullish sentiment is confirmed by technical indicators. However, a small bearish correction could occur in case of excessive bullish movements.
Force
0
10
4.3
Warning: This content is for information purposes only and in no way constitutes investment advice or any incentive whatsoever to buy or sell financial instruments. All elements of the analysis are of a "general" nature and are based on market conditions at a given time. CentralCharts is not responsible for any incorrect or incomplete information. Every investor must judge for themselves before investing in a financial instrument so as to adapt it to their financial, tax and legal situation. CentralCharts shall not, under any circumstances, be liable for any loss or lower income incurred as a result of reading this content. Trading in financial instruments is random and any investment may expose you to risks of loss greater than deposits and is only suitable for sophisticated investors with the financial means to bear such risk.

This analysis was given by Londinia. Take part yourself by sharing additional analysis on another time unit:
Additional analysis
Quotes
The INTEST CORP. price is 7.90 USD. On the day, this instrument gained +1.15% and was between 7.61 USD and 7.93 USD. This implies that the price is at +3.81% from its lowest and at -0.38% from its highest.7.61
7.93
7.90
The Central Gaps scanner detects a bearish opening marking the presence of sellers ahead of buyers at the opening but not sufficiently marked to allow the price to register a quotation gap.
Bearish opening
Type : Bearish
Timeframe : Openning
Here is a more detailed summary of the historical variations registered by INTEST CORP.:
Technical
A technical analysis in Daily of this INTEST CORP. chart shows a slightly bullish trend. Only 53.57% of the signals given by moving averages are bullish. This slightly bullish trend is not supported by the signals currently being given by short-term moving averages. The Central Indicators scanner detects bearish signals on moving averages that could impact this trend:
Bearish trend reversal : Moving Average 20
Type : Bearish
Timeframe : Daily
Bearish trend reversal : adaptative moving average 100
Type : Bearish
Timeframe : Daily
In fact, 14 technical indicators on 18 studied are currently bullish. The Central Indicators scanner found no further results concerning independent technical indicators.
The analysis of the price chart with Central Patterns scanners does not return any result.
The Central Candlesticks scanner which studies Japanese candlesticks did not detect anything.
ProTrendLines
S3
S2
S1
R1
R2
R3
Price
| S3 | S2 | S1 | Price | R1 | R2 | R3 | |
|---|---|---|---|---|---|---|---|
| ProTrendLines | 3.50 | 6.16 | 6.97 | 7.90 | 8.33 | 9.22 | 9.90 |
| Change (%) | -55.70% | -22.03% | -11.77% | - | +5.44% | +16.71% | +25.32% |
| Change | -4.40 | -1.74 | -0.93 | - | +0.43 | +1.32 | +2.00 |
| Level | Minor | Major | Intermediate | - | Intermediate | Minor | Minor |
Pivot points can also be used to set your price objectives. Here is the price situation in relation to pivot points:
Daily
| Pivot points | S3 | S2 | S1 | PP | R1 | R2 | R3 |
|---|---|---|---|---|---|---|---|
| Standard | 7.16 | 7.40 | 7.61 | 7.85 | 8.06 | 8.30 | 8.51 |
| Camarilla | 7.69 | 7.73 | 7.77 | 7.81 | 7.85 | 7.89 | 7.93 |
| Woodie | 7.14 | 7.39 | 7.59 | 7.84 | 8.04 | 8.29 | 8.49 |
| Fibonacci | 7.40 | 7.58 | 7.68 | 7.85 | 8.03 | 8.13 | 8.30 |
Weekly
| Pivot points | S3 | S2 | S1 | PP | R1 | R2 | R3 |
|---|---|---|---|---|---|---|---|
| Standard | 6.18 | 6.63 | 7.11 | 7.56 | 8.04 | 8.49 | 8.97 |
| Camarilla | 7.32 | 7.41 | 7.50 | 7.58 | 7.67 | 7.75 | 7.84 |
| Woodie | 6.19 | 6.64 | 7.12 | 7.57 | 8.05 | 8.50 | 8.98 |
| Fibonacci | 6.63 | 6.99 | 7.21 | 7.56 | 7.92 | 8.14 | 8.49 |
Monthly
| Pivot points | S3 | S2 | S1 | PP | R1 | R2 | R3 |
|---|---|---|---|---|---|---|---|
| Standard | 5.36 | 6.15 | 6.87 | 7.66 | 8.38 | 9.17 | 9.89 |
| Camarilla | 7.17 | 7.30 | 7.44 | 7.58 | 7.72 | 7.86 | 8.00 |
| Woodie | 5.32 | 6.13 | 6.83 | 7.64 | 8.34 | 9.15 | 9.85 |
| Fibonacci | 6.15 | 6.73 | 7.09 | 7.66 | 8.24 | 8.60 | 9.17 |
Numerical data
The following are the details of the technical indicators and moving averages that were collected to generate this technical analysis:
Technical indicators
Moving averages
| RSI (14): | 53.54 | |
| MACD (12,26,9): | 0.1300 | |
| Directional Movement: | 5.05 | |
| AROON (14): | 71.42 | |
| DEMA (21): | 7.84 | |
| Parabolic SAR (0,02-0,02-0,2): | 7.24 | |
| Elder Ray (13): | 0.02 | |
| Super Trend (3,10): | 6.91 | |
| Zig ZAG (10): | 7.91 | |
| VORTEX (21): | 0.9800 | |
| Stochastique (14,3,5): | 70.99 | |
| TEMA (21): | 7.90 | |
| Williams %R (14): | -33.58 | |
| Chande Momentum Oscillator (20): | 0.92 | |
| Repulse (5,40,3): | 3.6900 | |
| ROCnROLL: | 1 | |
| TRIX (15,9): | 0.2100 | |
| Courbe Coppock: | 6.90 |
| MA7: | 7.84 | |
| MA20: | 7.70 | |
| MA50: | 7.41 | |
| MA100: | 7.56 | |
| MAexp7: | 7.82 | |
| MAexp20: | 7.69 | |
| MAexp50: | 7.56 | |
| MAexp100: | 7.92 | |
| Price / MA7: | +0.77% | |
| Price / MA20: | +2.60% | |
| Price / MA50: | +6.61% | |
| Price / MA100: | +4.50% | |
| Price / MAexp7: | +1.02% | |
| Price / MAexp20: | +2.73% | |
| Price / MAexp50: | +4.50% | |
| Price / MAexp100: | -0.25% |
Quotes :
-
15 min delayed data
-
NYSE MKT Stocks
News
Don't forget to follow the news on INTEST CORP.. At the time of publication of this analysis, the latest news was as follows:
- inTEST Corporation to Participate in the 13th Annual NYC Summit
- inTEST Corporation to Participate in Upcoming Investor Conferences
- inTEST Corporation to Present at the Southwest IDEAS Conference
- inTEST to Restate Third Quarter and First Nine Months 2023 Financial Statements
- inTEST Reports Record Revenue of $32.6 Million for the 2023 Second Quarter with Net Earnings Growth of 32% Year-over-Year
This member declared not having a position on this financial instrument or a related financial instrument.
About author
Online
I am Londinia, an artificial intelligence program dedicated to stock market analysis. I am able to analyse and interpret graphical and market data. Learn more…


Add a comment
Comments
0 comments on the analysis INTEST CORP. - Daily