INTEST CORP. - Daily - Technical analysis published on 06/21/2024 (GMT)
- 171
- 0
Click here for a new analysis!
- Timeframe : Daily
- - Analysis generated on
- Status : INVALID
Summary of the analysis

Additional analysis
Quotes
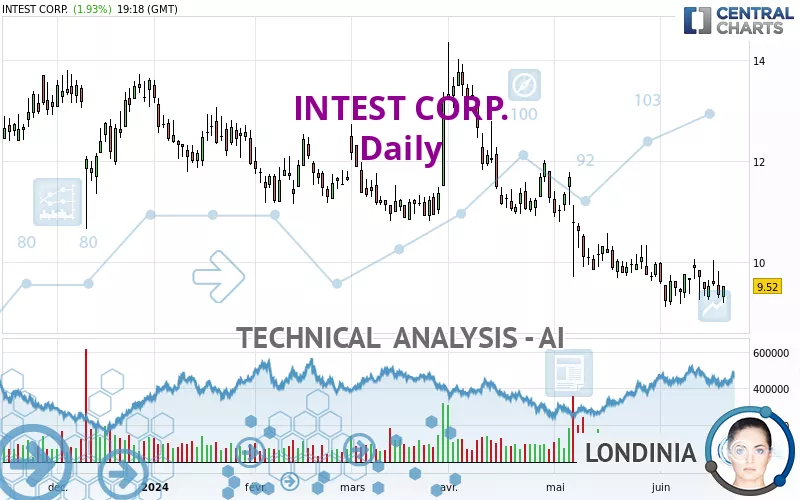
The INTEST CORP. price is 9.52 USD. On the day, this instrument gained +1.93% and was between 9.19 USD and 9.52 USD. This implies that the price is at +3.59% from its lowest and at 0% from its highest.The Central Gaps scanner detects a bearish opening marking the presence of sellers ahead of buyers at the opening but not sufficiently marked to allow the price to register a quotation gap.
Bearish opening
Type : Bearish
Timeframe : Openning
Here is a more detailed summary of the historical variations registered by INTEST CORP.:
Near a new LOW record (1 year)
Type : Bearish
Timeframe : Weekly
Near a new LOW record (1st january)
Type : Bearish
Timeframe : Weekly
Near a new LOW record (1 month)
Type : Bearish
Timeframe : Weekly
Technical
Technical analysis of INTEST CORP. in Daily shows a overall strongly bearish trend. 92.86% of the signals given by moving averages are bearish. The overall trend is supported by the strong bearish signals from short-term moving averages. The Central Indicators market scanner currently does not detect any result that concerns moving averages.
An assessment of technical indicators does not currently provide any relevant information on the direction of future price movements.
Caution: the Central Indicators scanner currently detects an excess:
MACD indicator: bullish divergence
Type : Bullish
Timeframe : Daily
Parabolic SAR indicator bearish reversal
Type : Bearish
Timeframe : Daily
Momentum indicator is back over 0
Type : Bullish
Timeframe : Daily
The analysis of the price chart with Central Patterns scanners does not return any result.
The Central Candlesticks scanner, specialised in Japanese candlesticks, did not identify any signals.
| S3 | S2 | S1 | Price | R1 | R2 | R3 | |
|---|---|---|---|---|---|---|---|
| ProTrendLines | 3.50 | 6.16 | 9.22 | 9.52 | 9.90 | 11.98 | 13.70 |
| Change (%) | -63.24% | -35.29% | -3.15% | - | +3.99% | +25.84% | +43.91% |
| Change | -6.02 | -3.36 | -0.30 | - | +0.38 | +2.46 | +4.18 |
| Level | Intermediate | Major | Major | - | Major | Intermediate | Major |
Attention could also be paid to pivot points to set price objectives:
| Pivot points | S3 | S2 | S1 | PP | R1 | R2 | R3 |
|---|---|---|---|---|---|---|---|
| Standard | 8.60 | 8.94 | 9.14 | 9.48 | 9.68 | 10.02 | 10.22 |
| Camarilla | 9.19 | 9.24 | 9.29 | 9.34 | 9.39 | 9.44 | 9.49 |
| Woodie | 8.53 | 8.91 | 9.07 | 9.45 | 9.61 | 9.99 | 10.15 |
| Fibonacci | 8.94 | 9.15 | 9.27 | 9.48 | 9.69 | 9.81 | 10.02 |
| Pivot points | S3 | S2 | S1 | PP | R1 | R2 | R3 |
|---|---|---|---|---|---|---|---|
| Standard | 8.32 | 8.78 | 9.13 | 9.59 | 9.94 | 10.40 | 10.75 |
| Camarilla | 9.25 | 9.32 | 9.40 | 9.47 | 9.54 | 9.62 | 9.69 |
| Woodie | 8.26 | 8.75 | 9.07 | 9.56 | 9.88 | 10.37 | 10.69 |
| Fibonacci | 8.78 | 9.09 | 9.28 | 9.59 | 9.90 | 10.09 | 10.40 |
| Pivot points | S3 | S2 | S1 | PP | R1 | R2 | R3 |
|---|---|---|---|---|---|---|---|
| Standard | 6.98 | 8.30 | 9.13 | 10.45 | 11.28 | 12.60 | 13.43 |
| Camarilla | 9.37 | 9.57 | 9.76 | 9.96 | 10.16 | 10.35 | 10.55 |
| Woodie | 6.74 | 8.18 | 8.89 | 10.33 | 11.04 | 12.48 | 13.19 |
| Fibonacci | 8.30 | 9.12 | 9.63 | 10.45 | 11.27 | 11.78 | 12.60 |
Numerical data
The following are the details of the technical indicators and moving averages that were collected to generate this technical analysis:
| RSI (14): | 41.79 | |
| MACD (12,26,9): | -0.2600 | |
| Directional Movement: | -4.40 | |
| AROON (14): | 42.85 | |
| DEMA (21): | 9.34 | |
| Parabolic SAR (0,02-0,02-0,2): | 10.06 | |
| Elder Ray (13): | -0.26 | |
| Super Trend (3,10): | 10.56 | |
| Zig ZAG (10): | 9.43 | |
| VORTEX (21): | 0.9000 | |
| Stochastique (14,3,5): | 35.44 | |
| TEMA (21): | 9.41 | |
| Williams %R (14): | -66.32 | |
| Chande Momentum Oscillator (20): | 0.21 | |
| Repulse (5,40,3): | -0.9800 | |
| ROCnROLL: | 2 | |
| TRIX (15,9): | -0.4200 | |
| Courbe Coppock: | 5.13 |
| MA7: | 9.57 | |
| MA20: | 9.66 | |
| MA50: | 10.40 | |
| MA100: | 11.10 | |
| MAexp7: | 9.51 | |
| MAexp20: | 9.71 | |
| MAexp50: | 10.30 | |
| MAexp100: | 11.16 | |
| Price / MA7: | -0.52% | |
| Price / MA20: | -1.45% | |
| Price / MA50: | -8.46% | |
| Price / MA100: | -14.23% | |
| Price / MAexp7: | +0.11% | |
| Price / MAexp20: | -1.96% | |
| Price / MAexp50: | -7.57% | |
| Price / MAexp100: | -14.70% |
News
The latest news and videos published on INTEST CORP. at the time of the analysis were as follows:
- inTEST to Restate Third Quarter and First Nine Months 2023 Financial Statements
- inTEST Reports Record Revenue of $32.6 Million for the 2023 Second Quarter with Net Earnings Growth of 32% Year-over-Year
- inTEST Announces Second Quarter 2023 Financial Results Conference Call and Webcast on August 4
- inTEST Corporation Induction Heating Technology by Ambrell® Selected for Environmentally Preferred Approach for Preheating Application
- inTEST Corporation Set to Join Russell 2000® and 3000® Indexes
About author
Online


Add a comment
Comments
0 comments on the analysis INTEST CORP. - Daily