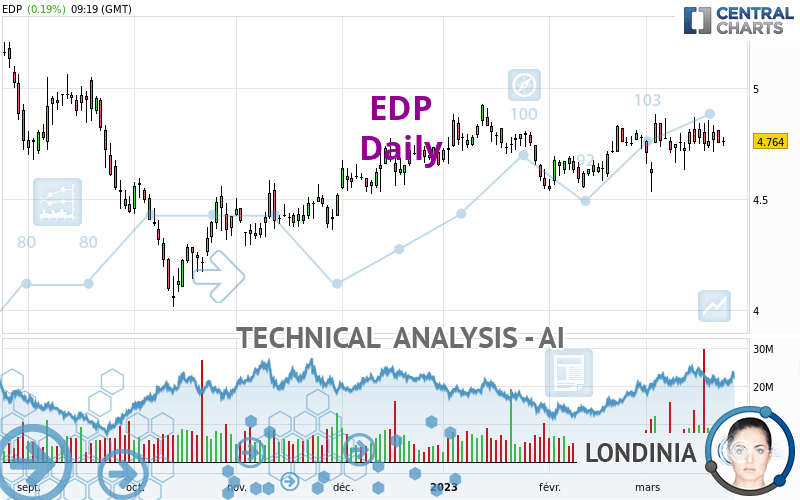
EDP - Daily - Technical analysis published on 03/23/2023 (GMT)
- 168
- 0
Click here for a new analysis!
- Timeframe : Daily
- - Analysis generated on
- Status : TARGET REACHED

Summary of the analysis

Additional analysis
Quotes
The EDP rating is 4.764 EUR. On the day, this instrument gained +0.19% and was traded between 4.742 EUR and 4.781 EUR over the period. The price is currently at +0.46% from its lowest and -0.36% from its highest.The Central Gaps scanner detects a bullish opening marking the presence of buyers ahead of sellers at the opening but not sufficiently marked to allow the price to register a quotation gap.
Bullish opening
Type : Bullish
Timeframe : Openning
Here is a more detailed summary of the historical variations registered by EDP:
Near a new LOW record (1st january)
Type : Bearish
Timeframe : Weekly
Near a new LOW record (1 month)
Type : Bearish
Timeframe : Weekly
Technical
Technical analysis of EDP in Daily shows a strongly overall bullish trend. The signals given by the moving averages are 85.71% bullish. This strong bullish trend is confirmed by the strong signals currently being given by short-term moving averages. The Central Indicators scanner detects bullish signals on moving averages that could impact this trend:
Bullish price crossover with Moving Average 20
Type : Bullish
Timeframe : Daily
Bullish price crossover with adaptative moving average 100
Type : Bullish
Timeframe : Daily
An assessment of technical indicators does not currently provide any relevant information on the direction of future price movements.
Central Indicators, the scanner specialised in technical indicators, has identified these signals:
Aroon indicator bearish trend
Type : Bearish
Timeframe : Daily
Price is back over the pivot point
Type : Bullish
Timeframe : Daily
Price is back over the pivot point
Type : Bullish
Timeframe : Weekly
Momentum indicator is back over 0
Type : Bullish
Timeframe : Daily
Williams %R indicator is back over -50
Type : Bullish
Timeframe : Daily
An analysis of the price chart with the Central Patterns scanner (detector of chart patterns and resistances and supports) shows a result that can have an impact on the price change:
Near support of triangle
Type : Bullish
Timeframe : Daily
For a small rebound in the very short term, the Central Candlesticks scanner currently notes the presence of this bullish pattern in Japanese candlesticks:
Bullish harami
Type : Bullish
Timeframe : Daily
| S3 | S2 | S1 | Price | R1 | R2 | R3 | |
|---|---|---|---|---|---|---|---|
| ProTrendLines | 4.334 | 4.522 | 4.723 | 4.764 | 4.809 | 4.924 | 5.186 |
| Change (%) | -9.03% | -5.08% | -0.86% | - | +0.94% | +3.36% | +8.86% |
| Change | -0.430 | -0.242 | -0.041 | - | +0.045 | +0.160 | +0.422 |
| Level | Major | Major | Major | - | Major | Minor | Major |
To determine price objectives, it is also possible to use the pivot points. Here is the price position in relation to pivot points:
| Pivot points | S3 | S2 | S1 | PP | R1 | R2 | R3 |
|---|---|---|---|---|---|---|---|
| Standard | 4.677 | 4.714 | 4.735 | 4.772 | 4.793 | 4.830 | 4.851 |
| Camarilla | 4.739 | 4.744 | 4.750 | 4.755 | 4.760 | 4.766 | 4.771 |
| Woodie | 4.668 | 4.710 | 4.726 | 4.768 | 4.784 | 4.826 | 4.842 |
| Fibonacci | 4.714 | 4.737 | 4.750 | 4.772 | 4.795 | 4.808 | 4.830 |
| Pivot points | S3 | S2 | S1 | PP | R1 | R2 | R3 |
|---|---|---|---|---|---|---|---|
| Standard | 4.391 | 4.512 | 4.630 | 4.751 | 4.869 | 4.990 | 5.108 |
| Camarilla | 4.683 | 4.705 | 4.727 | 4.749 | 4.771 | 4.793 | 4.815 |
| Woodie | 4.391 | 4.511 | 4.630 | 4.750 | 4.869 | 4.989 | 5.108 |
| Fibonacci | 4.512 | 4.603 | 4.659 | 4.751 | 4.842 | 4.898 | 4.990 |
| Pivot points | S3 | S2 | S1 | PP | R1 | R2 | R3 |
|---|---|---|---|---|---|---|---|
| Standard | 4.296 | 4.416 | 4.596 | 4.716 | 4.896 | 5.016 | 5.196 |
| Camarilla | 4.694 | 4.721 | 4.749 | 4.776 | 4.804 | 4.831 | 4.859 |
| Woodie | 4.326 | 4.431 | 4.626 | 4.731 | 4.926 | 5.031 | 5.226 |
| Fibonacci | 4.416 | 4.531 | 4.601 | 4.716 | 4.831 | 4.901 | 5.016 |
Numerical data
The following are the details of the technical indicators and moving averages that were collected to generate this technical analysis:
| RSI (14): | 51.69 | |
| MACD (12,26,9): | 0.0160 | |
| Directional Movement: | -0.371 | |
| AROON (14): | -42.857 | |
| DEMA (21): | 4.778 | |
| Parabolic SAR (0,02-0,02-0,2): | 4.613 | |
| Elder Ray (13): | -0.003 | |
| Super Trend (3,10): | 4.575 | |
| Zig ZAG (10): | 4.768 | |
| VORTEX (21): | 0.8940 | |
| Stochastique (14,3,5): | 61.34 | |
| TEMA (21): | 4.782 | |
| Williams %R (14): | -41.84 | |
| Chande Momentum Oscillator (20): | -0.006 | |
| Repulse (5,40,3): | -0.3410 | |
| ROCnROLL: | 1 | |
| TRIX (15,9): | 0.0560 | |
| Courbe Coppock: | 0.87 |
| MA7: | 4.774 | |
| MA20: | 4.761 | |
| MA50: | 4.723 | |
| MA100: | 4.655 | |
| MAexp7: | 4.770 | |
| MAexp20: | 4.756 | |
| MAexp50: | 4.725 | |
| MAexp100: | 4.686 | |
| Price / MA7: | -0.21% | |
| Price / MA20: | +0.06% | |
| Price / MA50: | +0.87% | |
| Price / MA100: | +2.34% | |
| Price / MAexp7: | -0.13% | |
| Price / MAexp20: | +0.17% | |
| Price / MAexp50: | +0.83% | |
| Price / MAexp100: | +1.66% |
News
The last news published on EDP at the time of the generation of this analysis was as follows:
- Parade Technologies Announces World’s First Integrated Display eDP Timing Controller with Embedded Source Drivers and Touchscreen Controller for Notebook LTPS and Oxide In-Cell Panels
- EDP Partners with Vodafone Portugal and TechSee to Launch Visual Assistance for Customers and Field Technicians
- NIPSCO, EDP Renewables to Bring Indiana Crossroads II Wind Farm and Indiana Crossroads Solar Park to Northwest Indiana
- EdpFinance B.V. - Half Year Report 2020
- Parade Introduces New eDP Tcons and Source Drivers Optimized for HDR Gaming Displays up to UHD Resolution
About author
Online


Add a comment
Comments
0 comments on the analysis EDP - Daily