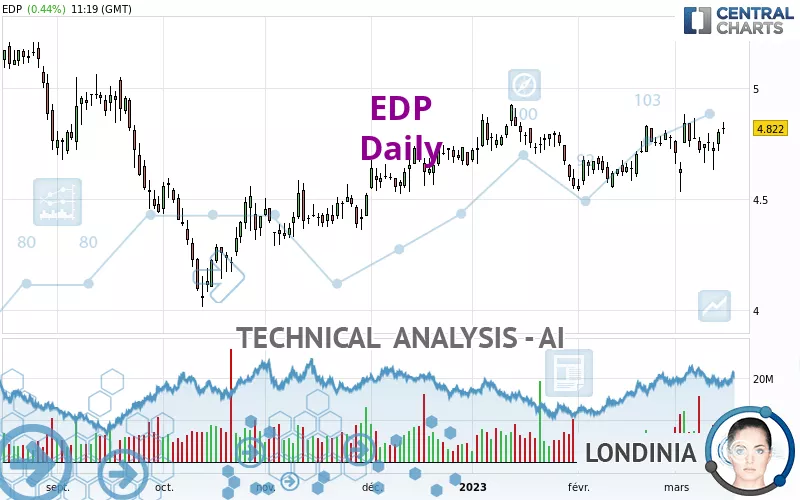
EDP - Daily - Technical analysis published on 03/15/2023 (GMT)
- 159
- 0
Click here for a new analysis!
- Timeframe : Daily
- - Analysis generated on
- Status : TARGET REACHED
Summary of the analysis

Additional analysis
Quotes
The EDP rating is 4.822 EUR. The price has increased by +0.44% since the last closing and was between 4.795 EUR and 4.850 EUR. This implies that the price is at +0.56% from its lowest and at -0.58% from its highest.A bullish opening was detected by the Central Gaps scanner. Buyers are trying to impose a bullish momentum in the very short term.
Bullish opening
Type : Bullish
Timeframe : Openning
So that you have an overall view of the price change, here is a table showing the variations over several periods:
Near a new HIGH record (1st january)
Type : Bullish
Timeframe : Weekly
Near a new HIGH record (1 month)
Type : Bullish
Timeframe : Weekly
Technical
Technical analysis of EDP in Daily shows a strongly overall bullish trend. The signals given by the moving averages are 85.71% bullish. This strong bullish trend is confirmed by the strong signals currently being given by short-term moving averages. The Central Indicators scanner does not detect any result on moving averages that would impact this trend.
In fact, according to the parameters integrated into the Central Analyzer system, 14 technical indicators out of 18 analysed are currently bullish. Caution: the Central Indicators scanner currently detects an excess:
CCI indicator is overbought : over 100
Type : Neutral
Timeframe : Daily
Price is back over the pivot point
Type : Bullish
Timeframe : Weekly
An analysis of the price chart with the Central Patterns scanner (detector of chart patterns and resistances and supports) shows several results that can have an impact on the price change:
Near resistance of channel
Type : Bearish
Timeframe : Daily
Near resistance of triangle
Type : Bearish
Timeframe : Daily
Central Candlesticks, the scanner specialised in Japanese candlesticks, detects this inversion signal that could impact the current short-term trend:
Doji
Type : Neutral
Timeframe : Daily
| S3 | S2 | S1 | Price | R1 | R2 | |
|---|---|---|---|---|---|---|
| ProTrendLines | 4.334 | 4.522 | 4.809 | 4.822 | 4.924 | 5.186 |
| Change (%) | -10.12% | -6.22% | -0.27% | - | +2.12% | +7.55% |
| Change | -0.488 | -0.300 | -0.013 | - | +0.102 | +0.364 |
| Level | Major | Major | Major | - | Minor | Major |
Attention could also be paid to pivot points to set price objectives:
| Pivot points | S3 | S2 | S1 | PP | R1 | R2 | R3 |
|---|---|---|---|---|---|---|---|
| Standard | 4.643 | 4.681 | 4.741 | 4.779 | 4.839 | 4.877 | 4.937 |
| Camarilla | 4.774 | 4.783 | 4.792 | 4.801 | 4.810 | 4.819 | 4.828 |
| Woodie | 4.654 | 4.687 | 4.752 | 4.785 | 4.850 | 4.883 | 4.948 |
| Fibonacci | 4.681 | 4.718 | 4.742 | 4.779 | 4.816 | 4.840 | 4.877 |
| Pivot points | S3 | S2 | S1 | PP | R1 | R2 | R3 |
|---|---|---|---|---|---|---|---|
| Standard | 4.453 | 4.558 | 4.656 | 4.761 | 4.859 | 4.964 | 5.062 |
| Camarilla | 4.698 | 4.717 | 4.735 | 4.754 | 4.773 | 4.791 | 4.810 |
| Woodie | 4.450 | 4.556 | 4.653 | 4.759 | 4.856 | 4.962 | 5.059 |
| Fibonacci | 4.558 | 4.636 | 4.684 | 4.761 | 4.839 | 4.887 | 4.964 |
| Pivot points | S3 | S2 | S1 | PP | R1 | R2 | R3 |
|---|---|---|---|---|---|---|---|
| Standard | 4.296 | 4.416 | 4.596 | 4.716 | 4.896 | 5.016 | 5.196 |
| Camarilla | 4.694 | 4.721 | 4.749 | 4.776 | 4.804 | 4.831 | 4.859 |
| Woodie | 4.326 | 4.431 | 4.626 | 4.731 | 4.926 | 5.031 | 5.226 |
| Fibonacci | 4.416 | 4.531 | 4.601 | 4.716 | 4.831 | 4.901 | 5.016 |
Numerical data
The following are the details of the technical indicators and moving averages that were collected to generate this technical analysis:
| RSI (14): | 56.40 | |
| MACD (12,26,9): | 0.0220 | |
| Directional Movement: | 2.335 | |
| AROON (14): | 7.143 | |
| DEMA (21): | 4.772 | |
| Parabolic SAR (0,02-0,02-0,2): | 4.578 | |
| Elder Ray (13): | 0.065 | |
| Super Trend (3,10): | 4.575 | |
| Zig ZAG (10): | 4.815 | |
| VORTEX (21): | 0.9850 | |
| Stochastique (14,3,5): | 70.07 | |
| TEMA (21): | 4.784 | |
| Williams %R (14): | -18.98 | |
| Chande Momentum Oscillator (20): | 0.018 | |
| Repulse (5,40,3): | 1.0860 | |
| ROCnROLL: | 1 | |
| TRIX (15,9): | 0.0530 | |
| Courbe Coppock: | 1.08 |
| MA7: | 4.763 | |
| MA20: | 4.751 | |
| MA50: | 4.728 | |
| MA100: | 4.635 | |
| MAexp7: | 4.773 | |
| MAexp20: | 4.746 | |
| MAexp50: | 4.713 | |
| MAexp100: | 4.676 | |
| Price / MA7: | +1.24% | |
| Price / MA20: | +1.49% | |
| Price / MA50: | +1.99% | |
| Price / MA100: | +4.03% | |
| Price / MAexp7: | +1.03% | |
| Price / MAexp20: | +1.60% | |
| Price / MAexp50: | +2.31% | |
| Price / MAexp100: | +3.12% |
News
The last news published on EDP at the time of the generation of this analysis was as follows:
- Parade Technologies Announces World’s First Integrated Display eDP Timing Controller with Embedded Source Drivers and Touchscreen Controller for Notebook LTPS and Oxide In-Cell Panels
- EDP Partners with Vodafone Portugal and TechSee to Launch Visual Assistance for Customers and Field Technicians
- NIPSCO, EDP Renewables to Bring Indiana Crossroads II Wind Farm and Indiana Crossroads Solar Park to Northwest Indiana
- EdpFinance B.V. - Half Year Report 2020
- Parade Introduces New eDP Tcons and Source Drivers Optimized for HDR Gaming Displays up to UHD Resolution
About author
Online


Add a comment
Comments
0 comments on the analysis EDP - Daily