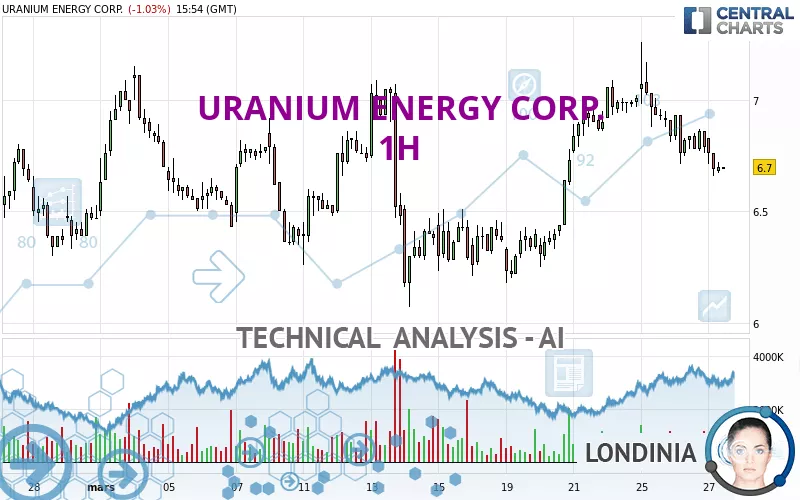
URANIUM ENERGY CORP. - 1H - Technical analysis published on 03/27/2024 (GMT)
- 147
- 0
Click here for a new analysis!
- Timeframe : 1H
- - Analysis generated on
- Status : INVALID

Summary of the analysis

Additional analysis
Quotes
The URANIUM ENERGY CORP. rating is 6.70 USD. On the day, this instrument lost -1.03% and was between 6.66 USD and 6.83 USD. This implies that the price is at +0.60% from its lowest and at -1.90% from its highest.The Central Gaps scanner detects a bullish opening. A small advantage for buyers in the very short term.
Bullish opening
Type : Bullish
Timeframe : Openning
A study of price movements over other periods shows the following variations:
Technical
Technical analysis of this 1H chart of URANIUM ENERGY CORP. indicates that the overall trend is not clearly defined. The trend could quickly turn bearish due to the strong bearish signals currently being given by short-term moving averages. An assessment of moving averages reveals several bearish signals that could impact this trend:
Bearish trend reversal : adaptative moving average 100
Type : Bearish
Timeframe : 1 hour
Bearish price crossover with adaptative moving average 50
Type : Bearish
Timeframe : 1 hour
In fact, of the 18 technical indicators analysed by Central Analyzer, 4 are bullish, 3 are neutral and 11 are bearish. Caution: the Central Indicators scanner currently detects an excess:
CCI indicator is oversold : under -100
Type : Neutral
Timeframe : 1 hour
CCI indicator: bullish divergence
Type : Bullish
Timeframe : 1 hour
RSI indicator: bullish divergence
Type : Bullish
Timeframe : 1 hour
Williams %R indicator is oversold : under -80
Type : Neutral
Timeframe : 1 hour
Price is back under the pivot point
Type : Bearish
Timeframe : Weekly
An analysis of the price chart with the Central Patterns scanner (detector of chart patterns and resistances and supports) shows several results that can have an impact on the price change:
Near horizontal support
Type : Bullish
Timeframe : 1 hour
Support of channel is broken
Type : Bearish
Timeframe : 1 hour
The Central Candlesticks scanner which studies Japanese candlesticks did not detect anything.
| S3 | S2 | S1 | Price | R1 | R2 | R3 | |
|---|---|---|---|---|---|---|---|
| ProTrendLines | 6.07 | 6.24 | 6.54 | 6.70 | 6.80 | 7.17 | 7.58 |
| Change (%) | -9.40% | -6.87% | -2.39% | - | +1.49% | +7.01% | +13.13% |
| Change | -0.63 | -0.46 | -0.16 | - | +0.10 | +0.47 | +0.88 |
| Level | Minor | Intermediate | Major | - | Minor | Major | Minor |
Pivot points can also be used to set your price objectives. Here is the price situation in relation to pivot points:
| Pivot points | S3 | S2 | S1 | PP | R1 | R2 | R3 |
|---|---|---|---|---|---|---|---|
| Standard | 6.46 | 6.58 | 6.68 | 6.80 | 6.90 | 7.02 | 7.12 |
| Camarilla | 6.71 | 6.73 | 6.75 | 6.77 | 6.79 | 6.81 | 6.83 |
| Woodie | 6.44 | 6.58 | 6.66 | 6.80 | 6.88 | 7.02 | 7.10 |
| Fibonacci | 6.58 | 6.67 | 6.72 | 6.80 | 6.89 | 6.94 | 7.02 |
| Pivot points | S3 | S2 | S1 | PP | R1 | R2 | R3 |
|---|---|---|---|---|---|---|---|
| Standard | 5.51 | 5.84 | 6.42 | 6.75 | 7.33 | 7.66 | 8.24 |
| Camarilla | 6.74 | 6.82 | 6.91 | 6.99 | 7.07 | 7.16 | 7.24 |
| Woodie | 5.63 | 5.90 | 6.54 | 6.81 | 7.45 | 7.72 | 8.36 |
| Fibonacci | 5.84 | 6.19 | 6.41 | 6.75 | 7.10 | 7.32 | 7.66 |
| Pivot points | S3 | S2 | S1 | PP | R1 | R2 | R3 |
|---|---|---|---|---|---|---|---|
| Standard | 3.60 | 4.92 | 5.70 | 7.02 | 7.80 | 9.12 | 9.90 |
| Camarilla | 5.90 | 6.10 | 6.29 | 6.48 | 6.67 | 6.87 | 7.06 |
| Woodie | 3.33 | 4.79 | 5.43 | 6.89 | 7.53 | 8.99 | 9.63 |
| Fibonacci | 4.92 | 5.72 | 6.22 | 7.02 | 7.82 | 8.32 | 9.12 |
Numerical data
The following is the status of technical indicators and moving averages registered at the time this technical analysis was created:
| RSI (14): | 41.96 | |
| MACD (12,26,9): | -0.0100 | |
| Directional Movement: | -4.20 | |
| AROON (14): | -92.86 | |
| DEMA (21): | 6.82 | |
| Parabolic SAR (0,02-0,02-0,2): | 7.00 | |
| Elder Ray (13): | -0.10 | |
| Super Trend (3,10): | 6.99 | |
| Zig ZAG (10): | 6.69 | |
| VORTEX (21): | 0.8700 | |
| Stochastique (14,3,5): | 8.86 | |
| TEMA (21): | 6.74 | |
| Williams %R (14): | -94.29 | |
| Chande Momentum Oscillator (20): | -0.25 | |
| Repulse (5,40,3): | -1.6300 | |
| ROCnROLL: | 2 | |
| TRIX (15,9): | 0.0600 | |
| Courbe Coppock: | 6.45 |
| MA7: | 6.76 | |
| MA20: | 6.62 | |
| MA50: | 7.12 | |
| MA100: | 6.76 | |
| MAexp7: | 6.76 | |
| MAexp20: | 6.82 | |
| MAexp50: | 6.76 | |
| MAexp100: | 6.72 | |
| Price / MA7: | -0.89% | |
| Price / MA20: | +1.21% | |
| Price / MA50: | -5.90% | |
| Price / MA100: | -0.89% | |
| Price / MAexp7: | -0.89% | |
| Price / MAexp20: | -1.76% | |
| Price / MAexp50: | -0.89% | |
| Price / MAexp100: | -0.30% |
News
Don't forget to follow the news on URANIUM ENERGY CORP.. At the time of publication of this analysis, the latest news was as follows:
- Uranium Energy Corp Announces the Appointment of Brent Berg as Senior Vice-President, U.S. Operations
- Uranium Energy Corp Files Fiscal 2024 Q2 Quarterly Report
- Uranium Energy Corp Intersects 6.28% eU3O8 Over 2.9 metres in a 25 metre Step Out from the Roughrider East Zone Deposit
- Uranium Energy Corp Publishes Fiscal Year 2023 Sustainability Report
- Uranium Energy Corp Restarting 100% Unhedged Uranium Production in Wyoming
About author
Online


Add a comment
Comments
0 comments on the analysis URANIUM ENERGY CORP. - 1H