GRAN TIERRA ENERGY INC. - Daily - Technical analysis published on 08/06/2024 (GMT)
- 121
- 0
Click here for a new analysis!
- Timeframe : Daily
- - Analysis generated on
- Status : INVALID

Summary of the analysis

Additional analysis
Quotes
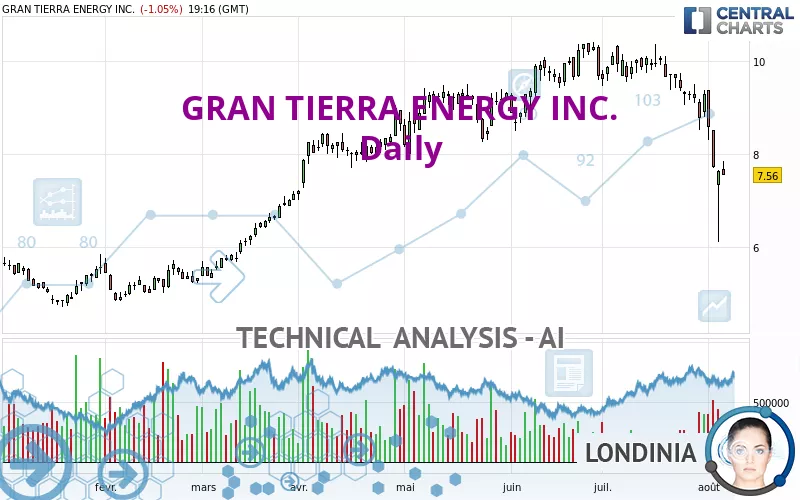
The GRAN TIERRA ENERGY INC. rating is 7.56 USD. The price is lower by -1.05% since the last closing and was between 7.54 USD and 7.86 USD. This implies that the price is at +0.27% from its lowest and at -3.82% from its highest.A bullish gap was detected at the opening by the Central Gaps scanner. There are a lot of buyers and they have the upper hand in the very short term.
Opening Gap UP
Type : Bullish
Timeframe : Openning
A study of price movements over other periods shows the following variations:
Technical
Technical analysis of this Daily chart of GRAN TIERRA ENERGY INC. indicates that the overall trend is bearish. 67.86% of the signals given by moving averages are bearish. This bearish trend is supported by the strong bearish signals given by short-term moving averages. There is no crossing of moving average by the price or crossing of moving averages between themselves.
An assessment of technical indicators does not currently provide any relevant information on the direction of future price movements.
But beware of excesses. The Central Indicators scanner currently detects this:
RSI indicator is oversold : under 30
Type : Neutral
Timeframe : Daily
CCI indicator is oversold : under -100
Type : Neutral
Timeframe : Daily
Previous candle closed under Bollinger bands
Type : Neutral
Timeframe : Daily
RSI indicator: bullish divergence
Type : Bullish
Timeframe : Daily
The Central Patterns scanner, which studies chart patterns, resistances and supports, has identified this signal:
Near support of channel
Type : Bullish
Timeframe : Daily
Central Candlesticks, the scanner specialised in Japanese candlesticks, detects a bearish signal that could support the hypothesis of a small drop in the very short term:
Bearish doji star
Type : Bearish
Timeframe : Daily
| S3 | S2 | S1 | Price | R1 | R2 | R3 | |
|---|---|---|---|---|---|---|---|
| ProTrendLines | 5.62 | 6.05 | 7.09 | 7.56 | 7.99 | 8.43 | 10.06 |
| Change (%) | -25.66% | -19.97% | -6.22% | - | +5.69% | +11.51% | +33.07% |
| Change | -1.94 | -1.51 | -0.47 | - | +0.43 | +0.87 | +2.50 |
| Level | Intermediate | Intermediate | Major | - | Minor | Intermediate | Major |
To determine price objectives, it is also possible to use the pivot points. Here is the price position in relation to pivot points:
| Pivot points | S3 | S2 | S1 | PP | R1 | R2 | R3 |
|---|---|---|---|---|---|---|---|
| Standard | 5.08 | 5.59 | 6.62 | 7.13 | 8.16 | 8.67 | 9.70 |
| Camarilla | 7.22 | 7.36 | 7.50 | 7.64 | 7.78 | 7.92 | 8.06 |
| Woodie | 5.33 | 5.72 | 6.87 | 7.26 | 8.41 | 8.80 | 9.95 |
| Fibonacci | 5.59 | 6.18 | 6.55 | 7.13 | 7.72 | 8.09 | 8.67 |
| Pivot points | S3 | S2 | S1 | PP | R1 | R2 | R3 |
|---|---|---|---|---|---|---|---|
| Standard | 5.35 | 6.53 | 7.13 | 8.31 | 8.91 | 10.09 | 10.69 |
| Camarilla | 7.24 | 7.40 | 7.57 | 7.73 | 7.89 | 8.06 | 8.22 |
| Woodie | 5.06 | 6.39 | 6.84 | 8.17 | 8.62 | 9.95 | 10.40 |
| Fibonacci | 6.53 | 7.21 | 7.63 | 8.31 | 8.99 | 9.41 | 10.09 |
| Pivot points | S3 | S2 | S1 | PP | R1 | R2 | R3 |
|---|---|---|---|---|---|---|---|
| Standard | 6.59 | 7.55 | 8.42 | 9.38 | 10.25 | 11.21 | 12.08 |
| Camarilla | 8.78 | 8.95 | 9.11 | 9.28 | 9.45 | 9.62 | 9.78 |
| Woodie | 6.54 | 7.53 | 8.37 | 9.36 | 10.20 | 11.19 | 12.03 |
| Fibonacci | 7.55 | 8.25 | 8.68 | 9.38 | 10.08 | 10.51 | 11.21 |
Numerical data
The following is the status of technical indicators and moving averages registered at the time this technical analysis was created:
| RSI (14): | 26.96 | |
| MACD (12,26,9): | -0.4700 | |
| Directional Movement: | -35.07 | |
| AROON (14): | -92.86 | |
| DEMA (21): | 8.49 | |
| Parabolic SAR (0,02-0,02-0,2): | 8.86 | |
| Elder Ray (13): | -1.00 | |
| Super Trend (3,10): | 8.76 | |
| Zig ZAG (10): | 7.61 | |
| VORTEX (21): | 0.7700 | |
| Stochastique (14,3,5): | 24.81 | |
| TEMA (21): | 8.00 | |
| Williams %R (14): | -62.16 | |
| Chande Momentum Oscillator (20): | -2.03 | |
| Repulse (5,40,3): | 0.2300 | |
| ROCnROLL: | 2 | |
| TRIX (15,9): | -0.3400 | |
| Courbe Coppock: | 31.49 |
| MA7: | 8.40 | |
| MA20: | 9.28 | |
| MA50: | 9.48 | |
| MA100: | 8.80 | |
| MAexp7: | 8.26 | |
| MAexp20: | 8.99 | |
| MAexp50: | 9.17 | |
| MAexp100: | 8.67 | |
| Price / MA7: | -10.00% | |
| Price / MA20: | -18.53% | |
| Price / MA50: | -20.25% | |
| Price / MA100: | -14.09% | |
| Price / MAexp7: | -8.47% | |
| Price / MAexp20: | -15.91% | |
| Price / MAexp50: | -17.56% | |
| Price / MAexp100: | -12.80% |
News
Don't forget to follow the news on GRAN TIERRA ENERGY INC.. At the time of publication of this analysis, the latest news was as follows:
- Gran Tierra Energy Inc. Completes Reverse Stock Split
- Gran Tierra Energy Inc. Announces Reverse Stock Split
- Gran Tierra Energy Announces Final Voting Results of its Annual Meeting of Stockholders
- Gran Tierra Energy Announces Final Voting Results of its Annual Meeting of Stockholders
- Gran Tierra Energy Inc. Announces First Quarter 2023 Results
About author
Online


Add a comment
Comments
0 comments on the analysis GRAN TIERRA ENERGY INC. - Daily