| Open: | - |
| Change: | - |
| Volume: | - |
| Low: | - |
| High: | - |
| High / Low range: | - |
| Type: | Stocks |
| Ticker: | SEB |
| ISIN: |
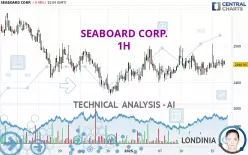
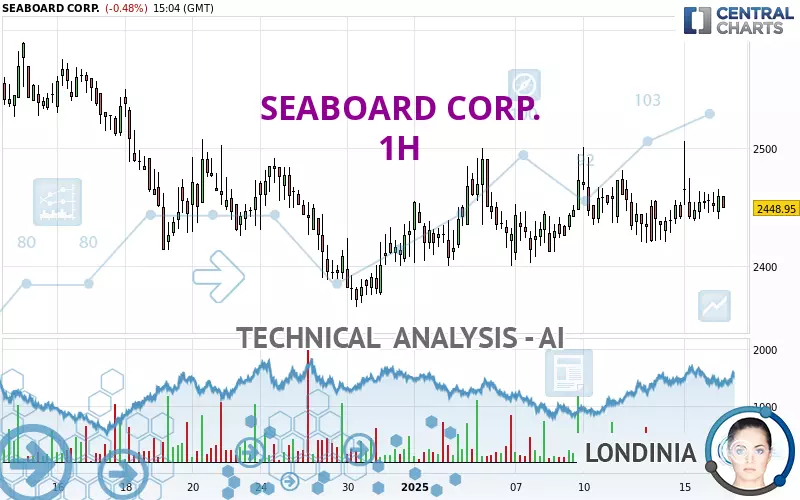
SEABOARD CORP. - 1H - Technical analysis published on 01/16/2025 (GMT)
- 82
- 0
- 01/16/2025 - 15:20
Click here for a new analysis!
- Timeframe : 1H
- - Analysis generated on 01/16/2025 - 15:20
- Status : LEVEL MAINTAINED
Summary of the analysis

Additional analysis
Quotes
The SEABOARD CORP. rating is 2,448.95 USD. On the day, this instrument lost -0.48% with the lowest point at 2,440.01 USD and the highest point at 2,465.00 USD. The deviation from the price is +0.37% for the low point and -0.65% for the high point.The Central Gaps scanner detects a bearish opening. A small advantage for sellers in the very short term.
Bearish opening
Type : Bearish
Timeframe : Openning
A study of price movements over other periods shows the following variations:
Near a new LOW record (5 years)
Type : Bearish
Timeframe : Weekly
Near a new LOW record (1 year)
Type : Bearish
Timeframe : Weekly
New HIGH record (1st january)
Type : Bullish
Timeframe : Weekly
Near a new HIGH record (1 month)
Type : Bullish
Timeframe : Weekly
Technical
Technical analysis of this 1H chart of SEABOARD CORP. indicates that the overall trend is slightly bullish. Only 60.71% of the signals given by moving averages are bullish. This slightly bullish trend is not supported by the signals currently being given by short-term moving averages. The Central Indicators scanner detects a bullish signal on moving averages that could impact this trend:
Bullish trend reversal : Moving Average 100
Type : Bullish
Timeframe : 1 hour
An assessment of technical indicators shows a slightly bullish signal.
Central Indicators, the detector scanner for these technical indicators has recently detected several signals:
RSI indicator is back under 50
Type : Bearish
Timeframe : 1 hour
Price is back over the pivot point
Type : Bullish
Timeframe : Weekly
Central Patterns, the market scanner focusing on chart patterns, resistances and supports found this result:
Near resistance of triangle
Type : Bearish
Timeframe : 1 hour
For a small rebound in the very short term, the Central Candlesticks scanner currently notes the presence of this bullish pattern in Japanese candlesticks:
Bullish engulfing lines
Type : Bullish
Timeframe : 1 hour
| S3 | S2 | S1 | Price | R1 | R2 | R3 | |
|---|---|---|---|---|---|---|---|
| ProTrendLines | 1,677.04 | 2,346.27 | 2,400.15 | 2,448.95 | 2,455.23 | 2,506.55 | 2,589.10 |
| Change (%) | -31.52% | -4.19% | -1.99% | - | +0.26% | +2.35% | +5.72% |
| Change | -771.91 | -102.68 | -48.80 | - | +6.28 | +57.60 | +140.15 |
| Level | Intermediate | Major | Intermediate | - | Minor | Major | Minor |
Attention could also be paid to pivot points to set price objectives:
| Pivot points | S3 | S2 | S1 | PP | R1 | R2 | R3 |
|---|---|---|---|---|---|---|---|
| Standard | 2,362.96 | 2,400.59 | 2,430.73 | 2,468.36 | 2,498.50 | 2,536.13 | 2,566.27 |
| Camarilla | 2,442.23 | 2,448.45 | 2,454.66 | 2,460.87 | 2,467.08 | 2,473.30 | 2,479.51 |
| Woodie | 2,359.22 | 2,398.72 | 2,426.99 | 2,466.49 | 2,494.76 | 2,534.26 | 2,562.53 |
| Fibonacci | 2,400.59 | 2,426.48 | 2,442.47 | 2,468.36 | 2,494.25 | 2,510.24 | 2,536.13 |
| Pivot points | S3 | S2 | S1 | PP | R1 | R2 | R3 |
|---|---|---|---|---|---|---|---|
| Standard | 2,299.84 | 2,349.92 | 2,400.83 | 2,450.91 | 2,501.82 | 2,551.90 | 2,602.81 |
| Camarilla | 2,423.97 | 2,433.23 | 2,442.48 | 2,451.74 | 2,461.00 | 2,470.26 | 2,479.51 |
| Woodie | 2,300.26 | 2,350.13 | 2,401.25 | 2,451.12 | 2,502.24 | 2,552.11 | 2,603.23 |
| Fibonacci | 2,349.92 | 2,388.50 | 2,412.33 | 2,450.91 | 2,489.49 | 2,513.32 | 2,551.90 |
| Pivot points | S3 | S2 | S1 | PP | R1 | R2 | R3 |
|---|---|---|---|---|---|---|---|
| Standard | 2,004.57 | 2,184.79 | 2,307.22 | 2,487.44 | 2,609.87 | 2,790.09 | 2,912.52 |
| Camarilla | 2,346.43 | 2,374.17 | 2,401.92 | 2,429.66 | 2,457.40 | 2,485.15 | 2,512.89 |
| Woodie | 1,975.69 | 2,170.34 | 2,278.34 | 2,472.99 | 2,580.99 | 2,775.64 | 2,883.64 |
| Fibonacci | 2,184.79 | 2,300.40 | 2,371.82 | 2,487.44 | 2,603.05 | 2,674.47 | 2,790.09 |
Numerical data
The following is the status of the technical indicators and moving averages at the time of publication of this technical analysis:
| RSI (14): | 51.87 | |
| MACD (12,26,9): | 2.5500 | |
| Directional Movement: | 10.80 | |
| AROON (14): | 57.14 | |
| DEMA (21): | 2,450.48 | |
| Parabolic SAR (0,02-0,02-0,2): | 2,439.27 | |
| Elder Ray (13): | 5.19 | |
| Super Trend (3,10): | 2,401.67 | |
| Zig ZAG (10): | 2,450.89 | |
| VORTEX (21): | 1.0000 | |
| Stochastique (14,3,5): | 39.32 | |
| TEMA (21): | 2,451.21 | |
| Williams %R (14): | -64.08 | |
| Chande Momentum Oscillator (20): | 11.59 | |
| Repulse (5,40,3): | -0.2700 | |
| ROCnROLL: | 1 | |
| TRIX (15,9): | 0.0100 | |
| Courbe Coppock: | 0.85 |
| MA7: | 2,446.37 | |
| MA20: | 2,454.54 | |
| MA50: | 2,567.37 | |
| MA100: | 2,823.99 | |
| MAexp7: | 2,450.98 | |
| MAexp20: | 2,447.48 | |
| MAexp50: | 2,444.42 | |
| MAexp100: | 2,453.80 | |
| Price / MA7: | +0.11% | |
| Price / MA20: | -0.23% | |
| Price / MA50: | -4.61% | |
| Price / MA100: | -13.28% | |
| Price / MAexp7: | -0.08% | |
| Price / MAexp20: | +0.06% | |
| Price / MAexp50: | +0.19% | |
| Price / MAexp100: | -0.20% |
News
The latest news and videos published on SEABOARD CORP. at the time of the analysis were as follows:
- 11/06/2019 - 11:00 Continental Grain Company Sells Its Participation in ContiLatin del Peru to Seaboard Corporation
About author
Online


Add a comment
Comments
0 comments on the analysis SEABOARD CORP. - 1H