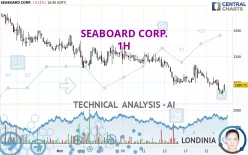
SEABOARD CORP. - 1H - Technical analysis published on 10/22/2024 (GMT)
- 145
- 0
Click here for a new analysis!
- Timeframe : 1H
- - Analysis generated on
- Status : LEVEL MAINTAINED

Summary of the analysis

Additional analysis
Quotes
The SEABOARD CORP. rating is 2,989.71 USD. The price is lower by -0.11% since the last closing and was between 2,950.00 USD and 3,010.00 USD. This implies that the price is at +1.35% from its lowest and at -0.67% from its highest.The Central Gaps scanner detects a bearish opening. A small advantage for sellers in the very short term.
Bearish opening
Type : Bearish
Timeframe : Openning
A study of price movements over other periods shows the following variations:
New LOW record (1 year)
Type : Bearish
Timeframe : Weekly
New LOW record (1st january)
Type : Bearish
Timeframe : Weekly
New LOW record (1 month)
Type : Bearish
Timeframe : Weekly
Technical
Technical analysis of this 1H chart of SEABOARD CORP. indicates that the overall trend is strongly bearish. The signals given by moving averages are 92.86% bearish. This strong bearish trend is confirmed by the strong signals currently being given by short-term moving averages. There is no crossing of moving average by the price or crossing of moving averages between themselves.
The probability of a further decline is moderate given the direction of the technical indicators.
Caution: the Central Indicators scanner currently detects an excess:
CCI indicator is oversold : under -100
Type : Neutral
Timeframe : 1 hour
Williams %R indicator is oversold : under -80
Type : Neutral
Timeframe : 1 hour
Pivot points : price is under support 1
Type : Neutral
Timeframe : 1 hour
Pivot points : price is under support 1
Type : Neutral
Timeframe : Weekly
The Central Patterns scanner, which studies chart patterns, resistances and supports, has identified this signal:
Near support of channel
Type : Bullish
Timeframe : 1 hour
The Central Candlesticks scanner which studies Japanese candlesticks did not detect anything.
| S3 | S2 | S1 | Price | R1 | R2 | R3 | |
|---|---|---|---|---|---|---|---|
| ProTrendLines | 1,678.42 | 2,662.51 | 2,980.00 | 2,989.71 | 3,017.21 | 3,069.78 | 3,136.85 |
| Change (%) | -43.86% | -10.94% | -0.32% | - | +0.92% | +2.68% | +4.92% |
| Change | -1,311.29 | -327.20 | -9.71 | - | +27.50 | +80.07 | +147.14 |
| Level | Minor | Major | Intermediate | - | Major | Major | Intermediate |
Pivot points can also be used to set your price objectives. Here is the price situation in relation to pivot points:
| Pivot points | S3 | S2 | S1 | PP | R1 | R2 | R3 |
|---|---|---|---|---|---|---|---|
| Standard | 2,907.21 | 2,943.61 | 2,968.33 | 3,004.73 | 3,029.45 | 3,065.85 | 3,090.57 |
| Camarilla | 2,976.25 | 2,981.86 | 2,987.46 | 2,993.06 | 2,998.66 | 3,004.27 | 3,009.87 |
| Woodie | 2,901.38 | 2,940.69 | 2,962.50 | 3,001.81 | 3,023.62 | 3,062.93 | 3,084.74 |
| Fibonacci | 2,943.61 | 2,966.96 | 2,981.38 | 3,004.73 | 3,028.08 | 3,042.50 | 3,065.85 |
| Pivot points | S3 | S2 | S1 | PP | R1 | R2 | R3 |
|---|---|---|---|---|---|---|---|
| Standard | 2,843.37 | 2,915.70 | 2,965.35 | 3,037.68 | 3,087.33 | 3,159.66 | 3,209.31 |
| Camarilla | 2,981.47 | 2,992.65 | 3,003.83 | 3,015.01 | 3,026.19 | 3,037.37 | 3,048.56 |
| Woodie | 2,832.04 | 2,910.03 | 2,954.02 | 3,032.01 | 3,076.00 | 3,153.99 | 3,197.98 |
| Fibonacci | 2,915.70 | 2,962.29 | 2,991.08 | 3,037.68 | 3,084.27 | 3,113.06 | 3,159.66 |
| Pivot points | S3 | S2 | S1 | PP | R1 | R2 | R3 |
|---|---|---|---|---|---|---|---|
| Standard | 2,764.67 | 2,904.33 | 3,020.67 | 3,160.33 | 3,276.67 | 3,416.33 | 3,532.67 |
| Camarilla | 3,066.60 | 3,090.07 | 3,113.53 | 3,137.00 | 3,160.47 | 3,183.93 | 3,207.40 |
| Woodie | 2,753.00 | 2,898.50 | 3,009.00 | 3,154.50 | 3,265.00 | 3,410.50 | 3,521.00 |
| Fibonacci | 2,904.33 | 3,002.13 | 3,062.54 | 3,160.33 | 3,258.13 | 3,318.54 | 3,416.33 |
Numerical data
The following are the details of the technical indicators and moving averages that were collected to generate this technical analysis:
| RSI (14): | 41.37 | |
| MACD (12,26,9): | -10.5100 | |
| Directional Movement: | -0.74 | |
| AROON (14): | -71.43 | |
| DEMA (21): | 2,999.85 | |
| Parabolic SAR (0,02-0,02-0,2): | 3,054.09 | |
| Elder Ray (13): | -7.89 | |
| Super Trend (3,10): | 3,059.18 | |
| Zig ZAG (10): | 2,998.33 | |
| VORTEX (21): | 0.9200 | |
| Stochastique (14,3,5): | 22.67 | |
| TEMA (21): | 3,000.75 | |
| Williams %R (14): | -78.75 | |
| Chande Momentum Oscillator (20): | -16.89 | |
| Repulse (5,40,3): | -0.2800 | |
| ROCnROLL: | 2 | |
| TRIX (15,9): | -0.0400 | |
| Courbe Coppock: | 1.37 |
| MA7: | 3,031.54 | |
| MA20: | 3,095.50 | |
| MA50: | 3,103.95 | |
| MA100: | 3,119.85 | |
| MAexp7: | 3,003.23 | |
| MAexp20: | 3,013.97 | |
| MAexp50: | 3,036.56 | |
| MAexp100: | 3,065.19 | |
| Price / MA7: | -1.38% | |
| Price / MA20: | -3.42% | |
| Price / MA50: | -3.68% | |
| Price / MA100: | -4.17% | |
| Price / MAexp7: | -0.45% | |
| Price / MAexp20: | -0.80% | |
| Price / MAexp50: | -1.54% | |
| Price / MAexp100: | -2.46% |
News
Don't forget to follow the news on SEABOARD CORP.. At the time of publication of this analysis, the latest news was as follows:
About author
Online


Add a comment
Comments
0 comments on the analysis SEABOARD CORP. - 1H