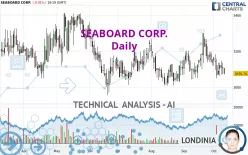
SEABOARD CORP. - Daily - Technical analysis published on 10/10/2024 (GMT)
- 145
- 0
Click here for a new analysis!
- Timeframe : Daily
- - Analysis generated on
- Status : TARGET REACHED

Summary of the analysis

Additional analysis
Quotes
The SEABOARD CORP. price is 3,076.74 USD. On the day, this instrument lost -0.91% with the lowest point at 3,071.00 USD and the highest point at 3,105.00 USD. The deviation from the price is +0.19% for the low point and -0.91% for the high point.The Central Gaps scanner detects a bearish opening. A small advantage for sellers in the very short term.
Bearish opening
Type : Bearish
Timeframe : Openning
Here is a more detailed summary of the historical variations registered by SEABOARD CORP.:
Near a new LOW record (1 year)
Type : Bearish
Timeframe : Weekly
Near a new LOW record (1st january)
Type : Bearish
Timeframe : Weekly
Near a new LOW record (1 month)
Type : Bearish
Timeframe : Weekly
Technical
Technical analysis of SEABOARD CORP. in Daily shows a overall strongly bearish trend. The signals given by moving averages are 85.71% bearish. This strong bearish trend is confirmed by the strong signals currently being given by short-term moving averages. There is no crossing of moving average by the price or crossing of moving averages between themselves.
An assessment of technical indicators does not currently provide any relevant information to suggest whether the signal given by the technical indicators is more bullish or bearish.
Caution: the Central Indicators scanner currently detects an excess:
CCI indicator is oversold : under -100
Type : Neutral
Timeframe : Daily
Williams %R indicator is oversold : under -80
Type : Neutral
Timeframe : Daily
Price is back under the pivot point
Type : Bearish
Timeframe : Daily
Central Patterns, the market scanner focusing on chart patterns, resistances and supports found these results:
Near support of channel
Type : Bullish
Timeframe : Daily
Horizontal support is broken
Type : Bearish
Timeframe : Daily
No result was found by the Central Candlesticks scanner on Japanese candlesticks.
| S3 | S2 | S1 | Price | R1 | R2 | R3 | |
|---|---|---|---|---|---|---|---|
| ProTrendLines | 1,678.42 | 2,662.51 | 3,017.21 | 3,076.74 | 3,088.41 | 3,186.14 | 3,378.76 |
| Change (%) | -45.45% | -13.46% | -1.93% | - | +0.38% | +3.56% | +9.82% |
| Change | -1,398.32 | -414.23 | -59.53 | - | +11.67 | +109.40 | +302.02 |
| Level | Minor | Major | Major | - | Major | Major | Major |
Pivot points can also be used to set your price objectives. Here is the price situation in relation to pivot points:
| Pivot points | S3 | S2 | S1 | PP | R1 | R2 | R3 |
|---|---|---|---|---|---|---|---|
| Standard | 3,003.99 | 3,037.00 | 3,070.99 | 3,104.00 | 3,137.99 | 3,171.00 | 3,204.99 |
| Camarilla | 3,086.57 | 3,092.71 | 3,098.85 | 3,104.99 | 3,111.13 | 3,117.27 | 3,123.42 |
| Woodie | 3,004.49 | 3,037.25 | 3,071.49 | 3,104.25 | 3,138.49 | 3,171.25 | 3,205.49 |
| Fibonacci | 3,037.00 | 3,062.59 | 3,078.40 | 3,104.00 | 3,129.59 | 3,145.40 | 3,171.00 |
| Pivot points | S3 | S2 | S1 | PP | R1 | R2 | R3 |
|---|---|---|---|---|---|---|---|
| Standard | 2,897.18 | 2,972.57 | 3,031.29 | 3,106.68 | 3,165.40 | 3,240.79 | 3,299.51 |
| Camarilla | 3,053.12 | 3,065.41 | 3,077.71 | 3,090.00 | 3,102.29 | 3,114.59 | 3,126.88 |
| Woodie | 2,888.84 | 2,968.40 | 3,022.95 | 3,102.51 | 3,157.06 | 3,236.62 | 3,291.17 |
| Fibonacci | 2,972.57 | 3,023.80 | 3,055.45 | 3,106.68 | 3,157.91 | 3,189.56 | 3,240.79 |
| Pivot points | S3 | S2 | S1 | PP | R1 | R2 | R3 |
|---|---|---|---|---|---|---|---|
| Standard | 2,764.67 | 2,904.33 | 3,020.67 | 3,160.33 | 3,276.67 | 3,416.33 | 3,532.67 |
| Camarilla | 3,066.60 | 3,090.07 | 3,113.53 | 3,137.00 | 3,160.47 | 3,183.93 | 3,207.40 |
| Woodie | 2,753.00 | 2,898.50 | 3,009.00 | 3,154.50 | 3,265.00 | 3,410.50 | 3,521.00 |
| Fibonacci | 2,904.33 | 3,002.13 | 3,062.54 | 3,160.33 | 3,258.13 | 3,318.54 | 3,416.33 |
Numerical data
The following is the status of technical indicators and moving averages registered at the time this technical analysis was created:
| RSI (14): | 43.05 | |
| MACD (12,26,9): | -8.3800 | |
| Directional Movement: | -2.89 | |
| AROON (14): | -64.29 | |
| DEMA (21): | 3,121.41 | |
| Parabolic SAR (0,02-0,02-0,2): | 3,199.35 | |
| Elder Ray (13): | -33.33 | |
| Super Trend (3,10): | 3,012.99 | |
| Zig ZAG (10): | 3,075.19 | |
| VORTEX (21): | 1.0000 | |
| Stochastique (14,3,5): | 21.30 | |
| TEMA (21): | 3,107.73 | |
| Williams %R (14): | -88.13 | |
| Chande Momentum Oscillator (20): | -98.88 | |
| Repulse (5,40,3): | -0.8300 | |
| ROCnROLL: | 2 | |
| TRIX (15,9): | 0.0200 | |
| Courbe Coppock: | 4.16 |
| MA7: | 3,103.40 | |
| MA20: | 3,145.08 | |
| MA50: | 3,117.83 | |
| MA100: | 3,141.48 | |
| MAexp7: | 3,107.84 | |
| MAexp20: | 3,127.26 | |
| MAexp50: | 3,130.42 | |
| MAexp100: | 3,157.80 | |
| Price / MA7: | -0.86% | |
| Price / MA20: | -2.17% | |
| Price / MA50: | -1.32% | |
| Price / MA100: | -2.06% | |
| Price / MAexp7: | -1.00% | |
| Price / MAexp20: | -1.62% | |
| Price / MAexp50: | -1.71% | |
| Price / MAexp100: | -2.57% |
News
The last news published on SEABOARD CORP. at the time of the generation of this analysis was as follows:
About author
Online


Add a comment
Comments
0 comments on the analysis SEABOARD CORP. - Daily