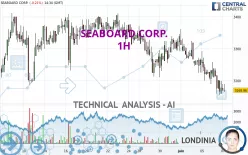
SEABOARD CORP. - 1H - Technical analysis published on 06/07/2024 (GMT)
- 148
- 0
Click here for a new analysis!
- Timeframe : 1H
- - Analysis generated on
- Status : INVALID

Summary of the analysis

Additional analysis
Quotes
SEABOARD CORP. rating 3,168.86 USD. The price is lower by -0.25% since the last closing and was traded between 3,164.70 USD and 3,189.90 USD over the period. The price is currently at +0.13% from its lowest and -0.66% from its highest.The Central Gaps scanner detects a bullish opening marking the presence of buyers ahead of sellers at the opening but not sufficiently marked to allow the price to register a quotation gap.
Bullish opening
Type : Bullish
Timeframe : Openning
Here is a more detailed summary of the historical variations registered by SEABOARD CORP.:
Near a new LOW record (1 year)
Type : Bearish
Timeframe : Weekly
Near a new LOW record (1st january)
Type : Bearish
Timeframe : Weekly
Near a new LOW record (1 month)
Type : Bearish
Timeframe : Weekly
Technical
Technical analysis of SEABOARD CORP. in 1H shows a overall strongly bearish trend. 92.86% of the signals given by moving averages are bearish. The overall trend is supported by the strong bearish signals from short-term moving averages. The Central Indicators market scanner currently does not detect any result that concerns moving averages.
In fact, 10 technical indicators on 18 studied are currently positioned bearish. Caution: the Central Indicators scanner currently detects an excess:
CCI indicator is oversold : under -100
Type : Neutral
Timeframe : 1 hour
Williams %R indicator is oversold : under -80
Type : Neutral
Timeframe : 1 hour
Pivot points : price is under support 1
Type : Neutral
Timeframe : Weekly
Central Patterns, the market scanner focusing on chart patterns, resistances and supports found this result:
Near support of channel
Type : Bullish
Timeframe : 1 hour
There is also a Japanese candlestick pattern detected by Central Candlesticks that could mark the end of the current short-term trend:
Doji
Type : Neutral
Timeframe : 1 hour
| S3 | S2 | S1 | Price | R1 | R2 | R3 | |
|---|---|---|---|---|---|---|---|
| ProTrendLines | 2,664.45 | 3,023.16 | 3,117.00 | 3,168.86 | 3,188.07 | 3,290.36 | 3,318.95 |
| Change (%) | -15.92% | -4.60% | -1.64% | - | +0.61% | +3.83% | +4.74% |
| Change | -504.41 | -145.70 | -51.86 | - | +19.21 | +121.50 | +150.09 |
| Level | Major | Major | Intermediate | - | Major | Minor | Minor |
Pivot points can also be used to set your price objectives. Here is the price situation in relation to pivot points:
| Pivot points | S3 | S2 | S1 | PP | R1 | R2 | R3 |
|---|---|---|---|---|---|---|---|
| Standard | 3,031.47 | 3,093.14 | 3,134.96 | 3,196.63 | 3,238.45 | 3,300.12 | 3,341.94 |
| Camarilla | 3,148.32 | 3,157.81 | 3,167.29 | 3,176.78 | 3,186.27 | 3,195.75 | 3,205.24 |
| Woodie | 3,021.55 | 3,088.18 | 3,125.04 | 3,191.67 | 3,228.53 | 3,295.16 | 3,332.02 |
| Fibonacci | 3,093.14 | 3,132.67 | 3,157.10 | 3,196.63 | 3,236.16 | 3,260.59 | 3,300.12 |
| Pivot points | S3 | S2 | S1 | PP | R1 | R2 | R3 |
|---|---|---|---|---|---|---|---|
| Standard | 3,082.68 | 3,146.76 | 3,243.95 | 3,308.03 | 3,405.22 | 3,469.30 | 3,566.49 |
| Camarilla | 3,296.78 | 3,311.56 | 3,326.35 | 3,341.13 | 3,355.91 | 3,370.70 | 3,385.48 |
| Woodie | 3,099.23 | 3,155.04 | 3,260.50 | 3,316.31 | 3,421.77 | 3,477.58 | 3,583.04 |
| Fibonacci | 3,146.76 | 3,208.37 | 3,246.43 | 3,308.03 | 3,369.64 | 3,407.70 | 3,469.30 |
| Pivot points | S3 | S2 | S1 | PP | R1 | R2 | R3 |
|---|---|---|---|---|---|---|---|
| Standard | 2,874.29 | 2,995.64 | 3,168.39 | 3,289.74 | 3,462.49 | 3,583.84 | 3,756.59 |
| Camarilla | 3,260.25 | 3,287.21 | 3,314.17 | 3,341.13 | 3,368.09 | 3,395.05 | 3,422.01 |
| Woodie | 2,899.98 | 3,008.49 | 3,194.08 | 3,302.59 | 3,488.18 | 3,596.69 | 3,782.28 |
| Fibonacci | 2,995.64 | 3,107.99 | 3,177.40 | 3,289.74 | 3,402.09 | 3,471.50 | 3,583.84 |
Numerical data
The following is the status of technical indicators and moving averages registered at the time this technical analysis was created:
| RSI (14): | 36.50 | |
| MACD (12,26,9): | -27.6900 | |
| Directional Movement: | -14.44 | |
| AROON (14): | -78.57 | |
| DEMA (21): | 3,180.55 | |
| Parabolic SAR (0,02-0,02-0,2): | 3,235.18 | |
| Elder Ray (13): | -22.93 | |
| Super Trend (3,10): | 3,280.02 | |
| Zig ZAG (10): | 3,171.00 | |
| VORTEX (21): | 0.8600 | |
| Stochastique (14,3,5): | 15.15 | |
| TEMA (21): | 3,168.32 | |
| Williams %R (14): | -77.69 | |
| Chande Momentum Oscillator (20): | -56.72 | |
| Repulse (5,40,3): | -0.7700 | |
| ROCnROLL: | 2 | |
| TRIX (15,9): | -0.1000 | |
| Courbe Coppock: | 4.08 |
| MA7: | 3,251.88 | |
| MA20: | 3,310.94 | |
| MA50: | 3,247.21 | |
| MA100: | 3,327.12 | |
| MAexp7: | 3,183.57 | |
| MAexp20: | 3,214.91 | |
| MAexp50: | 3,253.55 | |
| MAexp100: | 3,278.10 | |
| Price / MA7: | -2.55% | |
| Price / MA20: | -4.29% | |
| Price / MA50: | -2.41% | |
| Price / MA100: | -4.76% | |
| Price / MAexp7: | -0.46% | |
| Price / MAexp20: | -1.43% | |
| Price / MAexp50: | -2.60% | |
| Price / MAexp100: | -3.33% |
News
The latest news and videos published on SEABOARD CORP. at the time of the analysis were as follows:
About author
Online


Add a comment
Comments
0 comments on the analysis SEABOARD CORP. - 1H