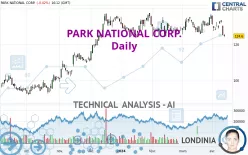
PARK NATIONAL CORP. - Daily - Technical analysis published on 04/11/2024 (GMT)
- 150
- 0
Click here for a new analysis!
- Timeframe : Daily
- - Analysis generated on
- Status : INVALID

Summary of the analysis

Additional analysis
Quotes
The PARK NATIONAL CORP. rating is 124.60 USD. The price is lower by -0.42% since the last closing and was traded between 124.12 USD and 125.55 USD over the period. The price is currently at +0.39% from its lowest and -0.76% from its highest.So that you have an overall view of the price change, here is a table showing the variations over several periods:
Near a new LOW record (1st january)
Type : Bearish
Timeframe : Weekly
New LOW record (1 month)
Type : Bearish
Timeframe : Weekly
Technical
A technical analysis in Daily of this PARK NATIONAL CORP. chart shows a slightly bearish trend. 60.71% of the signals given by moving averages are bearish. The overall trend could accelerate as a result of the strong bearish signals from short-term moving averages. An assessment of moving averages reveals several bearish signals that could impact this trend:
Bearish trend reversal : adaptative moving average 20
Type : Bearish
Timeframe : Daily
Bearish trend reversal : adaptative moving average 50
Type : Bearish
Timeframe : Daily
In fact, according to the parameters integrated into the Central Analyzer system, 11 technical indicators out of 18 analysed are currently bearish. Caution: the Central Indicators scanner currently detects an excess:
CCI indicator is oversold : under -100
Type : Neutral
Timeframe : Daily
Williams %R indicator is oversold : under -80
Type : Neutral
Timeframe : Daily
Pivot points : price is under support 1
Type : Neutral
Timeframe : Weekly
Central Patterns, the market scanner focusing on chart patterns, resistances and supports found these results:
Near horizontal support
Type : Bullish
Timeframe : Daily
Support of channel is broken
Type : Bearish
Timeframe : Daily
For a small rebound in the very short term, the Central Candlesticks scanner currently notes the presence of this bullish pattern in Japanese candlesticks:
Bullish doji star
Type : Bullish
Timeframe : Daily
| S3 | S2 | S1 | Price | R1 | R2 | R3 | |
|---|---|---|---|---|---|---|---|
| ProTrendLines | 110.11 | 117.93 | 124.00 | 124.60 | 132.28 | 136.63 | 147.20 |
| Change (%) | -11.63% | -5.35% | -0.48% | - | +6.16% | +9.65% | +18.14% |
| Change | -14.49 | -6.67 | -0.60 | - | +7.68 | +12.03 | +22.60 |
| Level | Major | Major | Major | - | Minor | Major | Major |
Attention could also be paid to pivot points to set price objectives:
| Pivot points | S3 | S2 | S1 | PP | R1 | R2 | R3 |
|---|---|---|---|---|---|---|---|
| Standard | 117.85 | 121.34 | 123.23 | 126.72 | 128.61 | 132.10 | 133.99 |
| Camarilla | 123.64 | 124.13 | 124.63 | 125.12 | 125.61 | 126.11 | 126.60 |
| Woodie | 117.05 | 120.94 | 122.43 | 126.32 | 127.81 | 131.70 | 133.19 |
| Fibonacci | 121.34 | 123.40 | 124.67 | 126.72 | 128.78 | 130.05 | 132.10 |
| Pivot points | S3 | S2 | S1 | PP | R1 | R2 | R3 |
|---|---|---|---|---|---|---|---|
| Standard | 117.60 | 122.48 | 126.22 | 131.10 | 134.84 | 139.72 | 143.46 |
| Camarilla | 127.59 | 128.38 | 129.17 | 129.96 | 130.75 | 131.54 | 132.33 |
| Woodie | 117.03 | 122.20 | 125.65 | 130.82 | 134.27 | 139.44 | 142.89 |
| Fibonacci | 122.48 | 125.77 | 127.81 | 131.10 | 134.39 | 136.43 | 139.72 |
| Pivot points | S3 | S2 | S1 | PP | R1 | R2 | R3 |
|---|---|---|---|---|---|---|---|
| Standard | 117.47 | 121.41 | 128.63 | 132.57 | 139.79 | 143.73 | 150.95 |
| Camarilla | 132.78 | 133.80 | 134.83 | 135.85 | 136.87 | 137.90 | 138.92 |
| Woodie | 119.11 | 122.23 | 130.27 | 133.39 | 141.43 | 144.55 | 152.59 |
| Fibonacci | 121.41 | 125.67 | 128.31 | 132.57 | 136.83 | 139.47 | 143.73 |
Numerical data
The following is the status of technical indicators and moving averages registered at the time this technical analysis was created:
| RSI (14): | 39.92 | |
| MACD (12,26,9): | -0.4700 | |
| Directional Movement: | -10.60 | |
| AROON (14): | -64.29 | |
| DEMA (21): | 129.51 | |
| Parabolic SAR (0,02-0,02-0,2): | 136.28 | |
| Elder Ray (13): | -4.68 | |
| Super Trend (3,10): | 134.48 | |
| Zig ZAG (10): | 124.60 | |
| VORTEX (21): | 0.8700 | |
| Stochastique (14,3,5): | 24.78 | |
| TEMA (21): | 128.63 | |
| Williams %R (14): | -96.13 | |
| Chande Momentum Oscillator (20): | -6.54 | |
| Repulse (5,40,3): | -3.3200 | |
| ROCnROLL: | 2 | |
| TRIX (15,9): | 0.0200 | |
| Courbe Coppock: | 1.40 |
| MA7: | 129.11 | |
| MA20: | 130.07 | |
| MA50: | 129.52 | |
| MA100: | 127.19 | |
| MAexp7: | 128.58 | |
| MAexp20: | 129.83 | |
| MAexp50: | 129.09 | |
| MAexp100: | 124.98 | |
| Price / MA7: | -3.49% | |
| Price / MA20: | -4.21% | |
| Price / MA50: | -3.80% | |
| Price / MA100: | -2.04% | |
| Price / MAexp7: | -3.10% | |
| Price / MAexp20: | -4.03% | |
| Price / MAexp50: | -3.48% | |
| Price / MAexp100: | -0.30% |
News
Don't forget to follow the news on PARK NATIONAL CORP.. At the time of publication of this analysis, the latest news was as follows:
- Park National Set to Join S&P SmallCap 600
-
 Park National
- Park National Corporation reports financial results for fourth quarter and full year 2016
-
Park National
- Park National Corporation Reports Financial Results for Third Quarter and First Nine Months of 2016
About author
Online


Add a comment
Comments
0 comments on the analysis PARK NATIONAL CORP. - Daily