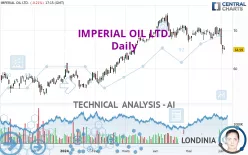
IMPERIAL OIL LTD. - Daily - Technical analysis published on 06/05/2024 (GMT)
- 104
- 0
Click here for a new analysis!
- Timeframe : Daily
- - Analysis generated on
- Status : INVALID
Summary of the analysis

Additional analysis
Quotes
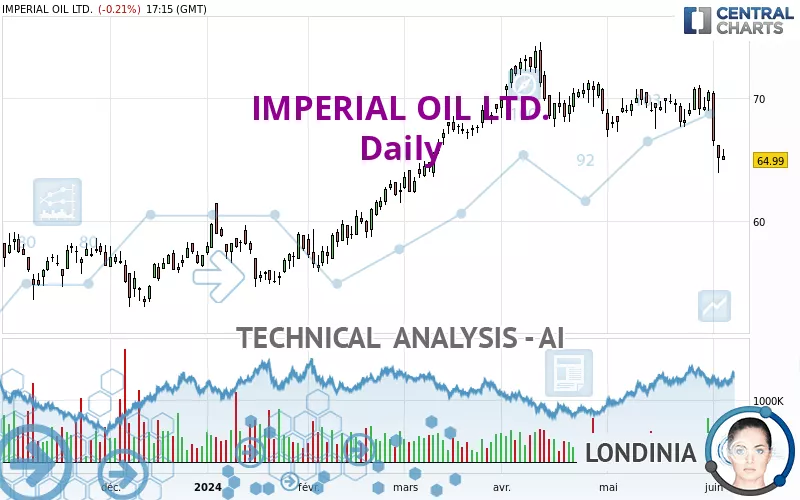
IMPERIAL OIL LTD. rating 64.99 USD. On the day, this instrument lost -0.22% with the lowest point at 64.95 USD and the highest point at 65.83 USD. The deviation from the price is +0.06% for the low point and -1.28% for the high point.A bullish opening was detected by the Central Gaps scanner. Buyers are trying to impose a bullish momentum in the very short term.
Bullish opening
Type : Bullish
Timeframe : Openning
Here is a more detailed summary of the historical variations registered by IMPERIAL OIL LTD.:
Near a new LOW record (1 month)
Type : Bearish
Timeframe : Weekly
Technical
Technical analysis of IMPERIAL OIL LTD. in Daily shows an overall bearish trend. 64.29% of the signals given by moving averages are bearish. The overall trend is reinforced by the strong bearish signals from short-term moving averages. The Central Indicators market scanner is currently detecting a bearish signal that could impact this trend:
Bearish trend reversal : adaptative moving average 100
Type : Bearish
Timeframe : Daily
The probability of a further decline is high given the direction of the technical indicators.
But beware of excesses. The Central Indicators scanner currently detects this:
CCI indicator is oversold : under -100
Type : Neutral
Timeframe : Daily
Previous candle closed under Bollinger bands
Type : Neutral
Timeframe : Daily
Williams %R indicator is oversold : under -80
Type : Neutral
Timeframe : Daily
Pivot points : price is under support 3
Type : Neutral
Timeframe : Weekly
Price is back under the pivot point
Type : Bearish
Timeframe : Daily
Central Patterns, the market scanner focusing on chart patterns, resistances and supports found these results:
Near horizontal support
Type : Bullish
Timeframe : Daily
Support of channel is broken
Type : Bearish
Timeframe : Daily
No result was found by the Central Candlesticks scanner on Japanese candlesticks.
| S3 | S2 | S1 | Price | R1 | R2 | R3 | |
|---|---|---|---|---|---|---|---|
| ProTrendLines | 57.73 | 59.77 | 62.37 | 64.99 | 67.39 | 70.74 | 73.88 |
| Change (%) | -11.17% | -8.03% | -4.03% | - | +3.69% | +8.85% | +13.68% |
| Change | -7.26 | -5.22 | -2.62 | - | +2.40 | +5.75 | +8.89 |
| Level | Minor | Intermediate | Intermediate | - | Major | Intermediate | Major |
Attention could also be paid to pivot points to set price objectives:
| Pivot points | S3 | S2 | S1 | PP | R1 | R2 | R3 |
|---|---|---|---|---|---|---|---|
| Standard | 61.59 | 62.74 | 63.93 | 65.08 | 66.27 | 67.42 | 68.61 |
| Camarilla | 64.49 | 64.70 | 64.92 | 65.13 | 65.35 | 65.56 | 65.77 |
| Woodie | 61.62 | 62.75 | 63.96 | 65.09 | 66.30 | 67.43 | 68.64 |
| Fibonacci | 62.74 | 63.63 | 64.18 | 65.08 | 65.97 | 66.52 | 67.42 |
| Pivot points | S3 | S2 | S1 | PP | R1 | R2 | R3 |
|---|---|---|---|---|---|---|---|
| Standard | 66.62 | 67.62 | 69.06 | 70.06 | 71.50 | 72.50 | 73.94 |
| Camarilla | 69.83 | 70.05 | 70.28 | 70.50 | 70.72 | 70.95 | 71.17 |
| Woodie | 66.84 | 67.73 | 69.28 | 70.17 | 71.72 | 72.61 | 74.16 |
| Fibonacci | 67.62 | 68.55 | 69.13 | 70.06 | 70.99 | 71.57 | 72.50 |
| Pivot points | S3 | S2 | S1 | PP | R1 | R2 | R3 |
|---|---|---|---|---|---|---|---|
| Standard | 63.59 | 65.19 | 67.85 | 69.45 | 72.11 | 73.71 | 76.37 |
| Camarilla | 69.33 | 69.72 | 70.11 | 70.50 | 70.89 | 71.28 | 71.67 |
| Woodie | 64.11 | 65.46 | 68.37 | 69.72 | 72.63 | 73.98 | 76.89 |
| Fibonacci | 65.19 | 66.82 | 67.83 | 69.45 | 71.08 | 72.09 | 73.71 |
Numerical data
The following is the status of technical indicators and moving averages registered at the time this technical analysis was created:
| RSI (14): | 35.42 | |
| MACD (12,26,9): | -0.6900 | |
| Directional Movement: | -18.45 | |
| AROON (14): | -28.57 | |
| DEMA (21): | 67.73 | |
| Parabolic SAR (0,02-0,02-0,2): | 70.68 | |
| Elder Ray (13): | -2.60 | |
| Super Trend (3,10): | 70.79 | |
| Zig ZAG (10): | 65.00 | |
| VORTEX (21): | 0.8500 | |
| Stochastique (14,3,5): | 14.09 | |
| TEMA (21): | 66.84 | |
| Williams %R (14): | -84.06 | |
| Chande Momentum Oscillator (20): | -5.01 | |
| Repulse (5,40,3): | -4.6400 | |
| ROCnROLL: | 2 | |
| TRIX (15,9): | -0.0500 | |
| Courbe Coppock: | 5.40 |
| MA7: | 68.04 | |
| MA20: | 68.86 | |
| MA50: | 69.67 | |
| MA100: | 65.34 | |
| MAexp7: | 67.19 | |
| MAexp20: | 68.43 | |
| MAexp50: | 68.22 | |
| MAexp100: | 65.92 | |
| Price / MA7: | -4.48% | |
| Price / MA20: | -5.62% | |
| Price / MA50: | -6.72% | |
| Price / MA100: | -0.54% | |
| Price / MAexp7: | -3.27% | |
| Price / MAexp20: | -5.03% | |
| Price / MAexp50: | -4.73% | |
| Price / MAexp100: | -1.41% |
News
The last news published on IMPERIAL OIL LTD. at the time of the generation of this analysis was as follows:
- Thinking about trading options or stock in Alibaba, Hologic, Imperial Oil, Wynn Resorts, or BioNTech?
- Imperial declares fourth quarter 2022 dividend
- Imperial declares second quarter 2021 dividend
- Imperial declares third quarter 2020 dividend
- Imperial announces second quarter 2020 financial and operating results
About author
Online


Add a comment
Comments
0 comments on the analysis IMPERIAL OIL LTD. - Daily