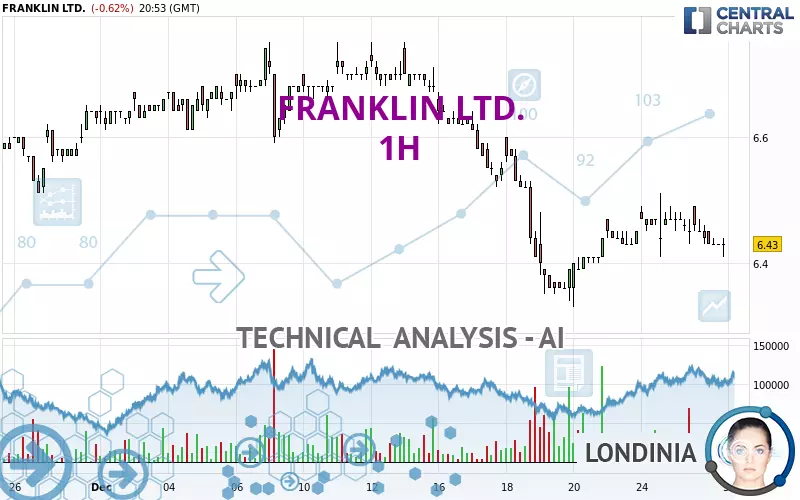
FRANKLIN LTD. - 1H - Technical analysis published on 12/27/2024 (GMT)
- 112
- 0
Click here for a new analysis!
- Timeframe : 1H
- - Analysis generated on
- Status : INVALID

Summary of the analysis

Additional analysis
Quotes
The FRANKLIN LTD. rating is 6.43 USD. The price is lower by -0.62% since the last closing and was between 6.41 USD and 6.49 USD. This implies that the price is at +0.31% from its lowest and at -0.92% from its highest.The Central Gaps scanner detects a bullish opening. A small advantage for buyers in the very short term.
Bullish opening
Type : Bullish
Timeframe : Openning
Here is a more detailed summary of the historical variations registered by FRANKLIN LTD.:
Near a new HIGH record (1 year)
Type : Bullish
Timeframe : Weekly
Near a new HIGH record (1st january)
Type : Bullish
Timeframe : Weekly
Near a new HIGH record (1 month)
Type : Bullish
Timeframe : Weekly
Technical
Technical analysis of this 1H chart of FRANKLIN LTD. indicates that the overall trend is strongly bearish. 82.14% of the signals given by moving averages are bearish. The slightly bearish signals from short-term moving averages show that the overall trend is slowing down. An assessment of moving averages reveals a bullish signal that could impact this trend:
Moving Average bullish crossovers : MA20 & MA50
Type : Bullish
Timeframe : 1 hour
In fact, Central Analyzer took into account 18 technical indicators and the result was as follows: 4 are bullish, 6 are neutral and 8 are bearish. Caution: the Central Indicators scanner currently detects an excess:
CCI indicator is oversold : under -100
Type : Neutral
Timeframe : 1 hour
Williams %R indicator is oversold : under -80
Type : Neutral
Timeframe : 1 hour
The Central Patterns scanner, which studies chart patterns, resistances and supports, has identified these signals:
Near horizontal support
Type : Bullish
Timeframe : 1 hour
Near support of triangle
Type : Bullish
Timeframe : 1 hour
Support of channel is broken
Type : Bearish
Timeframe : 1 hour
Central Candlesticks, the scanner specialised in Japanese candlesticks, detects this inversion signal that could impact the current short-term trend:
Doji
Type : Neutral
Timeframe : 1 hour
| S3 | S2 | S1 | Price | R1 | R2 | R3 | |
|---|---|---|---|---|---|---|---|
| ProTrendLines | 6.29 | 6.34 | 6.41 | 6.43 | 6.47 | 6.53 | 6.57 |
| Change (%) | -2.18% | -1.40% | -0.31% | - | +0.62% | +1.56% | +2.18% |
| Change | -0.14 | -0.09 | -0.02 | - | +0.04 | +0.10 | +0.14 |
| Level | Minor | Major | Minor | - | Minor | Minor | Major |
Attention could also be paid to pivot points to set price objectives:
| Pivot points | S3 | S2 | S1 | PP | R1 | R2 | R3 |
|---|---|---|---|---|---|---|---|
| Standard | 6.32 | 6.36 | 6.42 | 6.46 | 6.52 | 6.56 | 6.62 |
| Camarilla | 6.44 | 6.45 | 6.46 | 6.47 | 6.48 | 6.49 | 6.50 |
| Woodie | 6.32 | 6.37 | 6.42 | 6.47 | 6.52 | 6.57 | 6.62 |
| Fibonacci | 6.36 | 6.40 | 6.43 | 6.46 | 6.50 | 6.53 | 6.56 |
| Pivot points | S3 | S2 | S1 | PP | R1 | R2 | R3 |
|---|---|---|---|---|---|---|---|
| Standard | 5.95 | 6.14 | 6.29 | 6.48 | 6.63 | 6.82 | 6.97 |
| Camarilla | 6.35 | 6.38 | 6.41 | 6.44 | 6.47 | 6.50 | 6.53 |
| Woodie | 5.93 | 6.13 | 6.27 | 6.47 | 6.61 | 6.81 | 6.95 |
| Fibonacci | 6.14 | 6.27 | 6.35 | 6.48 | 6.61 | 6.69 | 6.82 |
| Pivot points | S3 | S2 | S1 | PP | R1 | R2 | R3 |
|---|---|---|---|---|---|---|---|
| Standard | 6.08 | 6.18 | 6.38 | 6.48 | 6.68 | 6.78 | 6.98 |
| Camarilla | 6.49 | 6.52 | 6.54 | 6.57 | 6.60 | 6.63 | 6.65 |
| Woodie | 6.12 | 6.21 | 6.42 | 6.51 | 6.72 | 6.81 | 7.02 |
| Fibonacci | 6.18 | 6.30 | 6.37 | 6.48 | 6.60 | 6.67 | 6.78 |
Numerical data
The following is the status of the technical indicators and moving averages at the time of publication of this technical analysis:
| RSI (14): | 43.19 | |
| MACD (12,26,9): | 0.0000 | |
| Directional Movement: | -12.90 | |
| AROON (14): | 0 | |
| DEMA (21): | 6.44 | |
| Parabolic SAR (0,02-0,02-0,2): | 6.49 | |
| Elder Ray (13): | -0.02 | |
| Super Trend (3,10): | 6.41 | |
| Zig ZAG (10): | 6.43 | |
| VORTEX (21): | 0.9400 | |
| Stochastique (14,3,5): | 22.78 | |
| TEMA (21): | 6.45 | |
| Williams %R (14): | -80.30 | |
| Chande Momentum Oscillator (20): | -0.04 | |
| Repulse (5,40,3): | -0.1800 | |
| ROCnROLL: | 2 | |
| TRIX (15,9): | 0.0000 | |
| Courbe Coppock: | 0.60 |
| MA7: | 6.44 | |
| MA20: | 6.55 | |
| MA50: | 6.48 | |
| MA100: | 6.46 | |
| MAexp7: | 6.44 | |
| MAexp20: | 6.45 | |
| MAexp50: | 6.47 | |
| MAexp100: | 6.50 | |
| Price / MA7: | -0.16% | |
| Price / MA20: | -1.83% | |
| Price / MA50: | -0.77% | |
| Price / MA100: | -0.46% | |
| Price / MAexp7: | -0.16% | |
| Price / MAexp20: | -0.31% | |
| Price / MAexp50: | -0.62% | |
| Price / MAexp100: | -1.08% |
News
The latest news and videos published on FRANKLIN LTD. at the time of the analysis were as follows:
- Franklin Limited Duration Income Trust Declares Monthly Distribution
- Franklin Limited Duration Income Trust Announces Sources of Monthly Dividend Distribution
- Franklin Limited Duration Income Trust Declares Monthly Distribution
- Franklin Limited Duration Income Trust Announces Sources of Monthly Dividend Distribution
- Franklin Limited Duration Income Trust Declares Monthly Distribution
About author
Online


Add a comment
Comments
0 comments on the analysis FRANKLIN LTD. - 1H