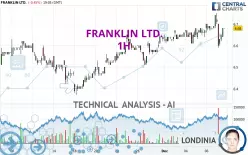
FRANKLIN LTD. - 1H - Technical analysis published on 12/09/2024 (GMT)
- 140
- 0
Click here for a new analysis!
- Timeframe : 1H
- - Analysis generated on
- Status : LEVEL MAINTAINED

Summary of the analysis

Additional analysis
Quotes
The FRANKLIN LTD. rating is 6.68 USD. On the day, this instrument lost -0.45% and was traded between 6.59 USD and 6.75 USD over the period. The price is currently at +1.37% from its lowest and -1.04% from its highest.So that you have an overall view of the price change, here is a table showing the variations over several periods:
New HIGH record (1 year)
Type : Bullish
Timeframe : Weekly
New HIGH record (1st january)
Type : Bullish
Timeframe : Weekly
New HIGH record (1 month)
Type : Bullish
Timeframe : Weekly
Technical
Technical analysis of FRANKLIN LTD. in 1H shows a strongly overall bullish trend. The signals given by moving averages are 82.14% bullish. This strongly bullish trend seems to be running out of steam given the signals being given by short-term moving averages. The Central Indicators market scanner is currently detecting several bullish signals that could impact this trend:
Bullish trend reversal : Moving Average 20
Type : Bullish
Timeframe : 1 hour
Bullish trend reversal : adaptative moving average 50
Type : Bullish
Timeframe : 1 hour
Bullish price crossover with Moving Average 20
Type : Bullish
Timeframe : 1 hour
The technical indicators are generally neutral. They do not provide relevant information on the direction of future price movements.
Central Indicators, the detector scanner for these technical indicators recently detected a signal:
Price is back under the pivot point
Type : Bearish
Timeframe : Weekly
Central Patterns, the scanner specializing in chart patterns, did not identify any signals.
No result was found by the Central Candlesticks scanner on Japanese candlesticks.
| S3 | S2 | S1 | Price | R1 | R2 | R3 | |
|---|---|---|---|---|---|---|---|
| ProTrendLines | 6.40 | 6.56 | 6.63 | 6.68 | 6.70 | 7.41 | 7.76 |
| Change (%) | -4.19% | -1.80% | -0.75% | - | +0.30% | +10.93% | +16.17% |
| Change | -0.28 | -0.12 | -0.05 | - | +0.02 | +0.73 | +1.08 |
| Level | Intermediate | Minor | Major | - | Minor | Intermediate | Major |
To determine price objectives, it is also possible to use the pivot points. Here is the price position in relation to pivot points:
| Pivot points | S3 | S2 | S1 | PP | R1 | R2 | R3 |
|---|---|---|---|---|---|---|---|
| Standard | 6.59 | 6.62 | 6.67 | 6.70 | 6.75 | 6.78 | 6.83 |
| Camarilla | 6.69 | 6.70 | 6.70 | 6.71 | 6.72 | 6.73 | 6.73 |
| Woodie | 6.59 | 6.63 | 6.67 | 6.71 | 6.75 | 6.79 | 6.83 |
| Fibonacci | 6.62 | 6.65 | 6.67 | 6.70 | 6.73 | 6.75 | 6.78 |
| Pivot points | S3 | S2 | S1 | PP | R1 | R2 | R3 |
|---|---|---|---|---|---|---|---|
| Standard | 6.50 | 6.56 | 6.63 | 6.69 | 6.76 | 6.82 | 6.89 |
| Camarilla | 6.67 | 6.69 | 6.70 | 6.71 | 6.72 | 6.73 | 6.75 |
| Woodie | 6.52 | 6.56 | 6.65 | 6.69 | 6.78 | 6.82 | 6.91 |
| Fibonacci | 6.56 | 6.61 | 6.64 | 6.69 | 6.74 | 6.77 | 6.82 |
| Pivot points | S3 | S2 | S1 | PP | R1 | R2 | R3 |
|---|---|---|---|---|---|---|---|
| Standard | 6.13 | 6.24 | 6.43 | 6.54 | 6.73 | 6.84 | 7.03 |
| Camarilla | 6.54 | 6.57 | 6.59 | 6.62 | 6.65 | 6.68 | 6.70 |
| Woodie | 6.17 | 6.26 | 6.47 | 6.56 | 6.77 | 6.86 | 7.07 |
| Fibonacci | 6.24 | 6.36 | 6.43 | 6.54 | 6.66 | 6.73 | 6.84 |
Numerical data
The following is the status of the technical indicators and moving averages at the time of publication of this technical analysis:
| RSI (14): | 45.74 | |
| MACD (12,26,9): | 0.0000 | |
| Directional Movement: | -2.45 | |
| AROON (14): | -7.14 | |
| DEMA (21): | 6.67 | |
| Parabolic SAR (0,02-0,02-0,2): | 6.75 | |
| Elder Ray (13): | -0.04 | |
| Super Trend (3,10): | 6.72 | |
| Zig ZAG (10): | 6.65 | |
| VORTEX (21): | 0.9600 | |
| Stochastique (14,3,5): | 22.92 | |
| TEMA (21): | 6.66 | |
| Williams %R (14): | -62.50 | |
| Chande Momentum Oscillator (20): | -0.01 | |
| Repulse (5,40,3): | 0.0500 | |
| ROCnROLL: | -1 | |
| TRIX (15,9): | 0.0200 | |
| Courbe Coppock: | 0.10 |
| MA7: | 6.66 | |
| MA20: | 6.56 | |
| MA50: | 6.54 | |
| MA100: | 6.48 | |
| MAexp7: | 6.66 | |
| MAexp20: | 6.66 | |
| MAexp50: | 6.64 | |
| MAexp100: | 6.60 | |
| Price / MA7: | +0.30% | |
| Price / MA20: | +1.83% | |
| Price / MA50: | +2.14% | |
| Price / MA100: | +3.09% | |
| Price / MAexp7: | +0.30% | |
| Price / MAexp20: | +0.30% | |
| Price / MAexp50: | +0.60% | |
| Price / MAexp100: | +1.21% |
News
Don't forget to follow the news on FRANKLIN LTD.. At the time of publication of this analysis, the latest news was as follows:
- Franklin Limited Duration Income Trust Declares Monthly Distribution
- Franklin Limited Duration Income Trust Announces Sources of Monthly Dividend Distribution
- Franklin Limited Duration Income Trust Declares Monthly Distribution
- Franklin Limited Duration Income Trust Announces Sources of Monthly Dividend Distribution
- Franklin Limited Duration Income Trust Declares Monthly Distribution
About author
Online


Add a comment
Comments
0 comments on the analysis FRANKLIN LTD. - 1H