FRANKLIN LTD. - 1H - Technical analysis published on 12/04/2024 (GMT)
- 81
- 0
Click here for a new analysis!
- Timeframe : 1H
- - Analysis generated on
- Status : LEVEL MAINTAINED

Summary of the analysis

Additional analysis
Quotes
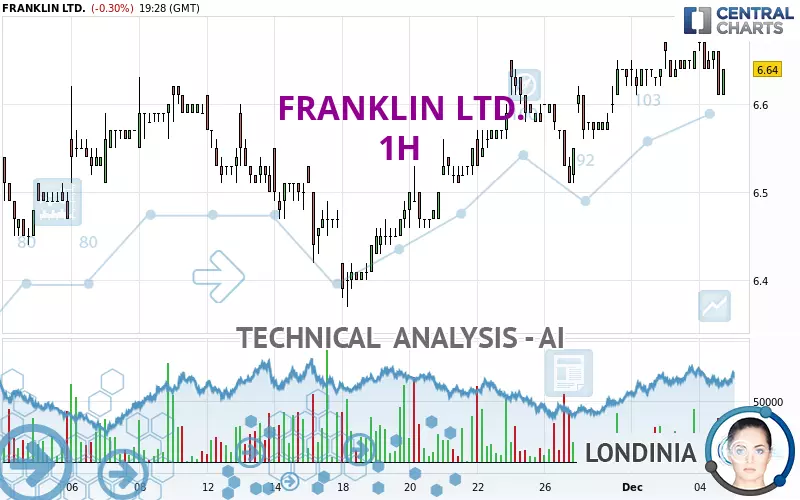
The FRANKLIN LTD. rating is 6.64 USD. The price is lower by -0.30% since the last closing and was between 6.61 USD and 6.67 USD. This implies that the price is at +0.45% from its lowest and at -0.45% from its highest.A study of price movements over other periods shows the following variations:
Near a new HIGH record (1 year)
Type : Bullish
Timeframe : Weekly
Near a new HIGH record (1st january)
Type : Bullish
Timeframe : Weekly
New HIGH record (1 month)
Type : Bullish
Timeframe : Weekly
Technical
A technical analysis in 1H of this FRANKLIN LTD. chart shows a bullish trend. The signals given by moving averages are 71.43% bullish. This bullish trend could slow down given the neutral signals currently being given by short-term moving averages. The Central Indicators scanner detects a bearish signal on moving averages that could impact this trend:
Bearish price crossover with Moving Average 20
Type : Bearish
Timeframe : 1 hour
On the 18 technical indicators analysed, 5 are bullish, 6 are neutral and 7 are bearish. Other results related to technical indicators were also found by the Central Indicators scanner:
Pivot points : price is under support 1
Type : Neutral
Timeframe : 1 hour
Williams %R indicator is back over -50
Type : Bullish
Timeframe : 1 hour
Central Patterns, the market scanner focusing on chart patterns, resistances and supports found this result:
Near support of channel
Type : Bullish
Timeframe : 1 hour
Central Candlesticks, the scanner specialised in Japanese candlesticks, detects this inversion signal that could impact the current short-term trend:
Doji
Type : Neutral
Timeframe : 1 hour
| S3 | S2 | S1 | Price | R1 | R2 | R3 | |
|---|---|---|---|---|---|---|---|
| ProTrendLines | 6.51 | 6.56 | 6.63 | 6.64 | 7.41 | 7.76 | 8.01 |
| Change (%) | -1.96% | -1.20% | -0.15% | - | +11.60% | +16.87% | +20.63% |
| Change | -0.13 | -0.08 | -0.01 | - | +0.77 | +1.12 | +1.37 |
| Level | Minor | Minor | Major | - | Intermediate | Major | Intermediate |
Attention could also be paid to pivot points to set price objectives:
| Pivot points | S3 | S2 | S1 | PP | R1 | R2 | R3 |
|---|---|---|---|---|---|---|---|
| Standard | 6.60 | 6.61 | 6.64 | 6.65 | 6.68 | 6.69 | 6.72 |
| Camarilla | 6.65 | 6.65 | 6.66 | 6.66 | 6.66 | 6.67 | 6.67 |
| Woodie | 6.60 | 6.62 | 6.64 | 6.66 | 6.68 | 6.70 | 6.72 |
| Fibonacci | 6.61 | 6.63 | 6.64 | 6.65 | 6.67 | 6.68 | 6.69 |
| Pivot points | S3 | S2 | S1 | PP | R1 | R2 | R3 |
|---|---|---|---|---|---|---|---|
| Standard | 6.40 | 6.46 | 6.54 | 6.60 | 6.68 | 6.74 | 6.82 |
| Camarilla | 6.59 | 6.60 | 6.62 | 6.63 | 6.64 | 6.66 | 6.67 |
| Woodie | 6.42 | 6.47 | 6.56 | 6.61 | 6.70 | 6.75 | 6.84 |
| Fibonacci | 6.46 | 6.51 | 6.54 | 6.60 | 6.65 | 6.68 | 6.74 |
| Pivot points | S3 | S2 | S1 | PP | R1 | R2 | R3 |
|---|---|---|---|---|---|---|---|
| Standard | 6.14 | 6.24 | 6.44 | 6.54 | 6.74 | 6.84 | 7.04 |
| Camarilla | 6.55 | 6.58 | 6.60 | 6.63 | 6.66 | 6.69 | 6.71 |
| Woodie | 6.18 | 6.27 | 6.48 | 6.57 | 6.78 | 6.87 | 7.08 |
| Fibonacci | 6.24 | 6.36 | 6.43 | 6.54 | 6.66 | 6.73 | 6.84 |
Numerical data
The following is the status of the technical indicators and moving averages at the time of publication of this technical analysis:
| RSI (14): | 46.45 | |
| MACD (12,26,9): | 0.0100 | |
| Directional Movement: | -3.95 | |
| AROON (14): | -78.57 | |
| DEMA (21): | 6.66 | |
| Parabolic SAR (0,02-0,02-0,2): | 6.67 | |
| Elder Ray (13): | 0 | |
| Super Trend (3,10): | 6.61 | |
| Zig ZAG (10): | 6.62 | |
| VORTEX (21): | 0.8900 | |
| Stochastique (14,3,5): | 28.89 | |
| TEMA (21): | 6.64 | |
| Williams %R (14): | -91.67 | |
| Chande Momentum Oscillator (20): | -0.04 | |
| Repulse (5,40,3): | -0.6200 | |
| ROCnROLL: | -1 | |
| TRIX (15,9): | 0.0300 | |
| Courbe Coppock: | 0.14 |
| MA7: | 6.62 | |
| MA20: | 6.54 | |
| MA50: | 6.53 | |
| MA100: | 6.46 | |
| MAexp7: | 6.63 | |
| MAexp20: | 6.64 | |
| MAexp50: | 6.60 | |
| MAexp100: | 6.56 | |
| Price / MA7: | +0.30% | |
| Price / MA20: | +1.53% | |
| Price / MA50: | +1.68% | |
| Price / MA100: | +2.79% | |
| Price / MAexp7: | +0.15% | |
| Price / MAexp20: | -0% | |
| Price / MAexp50: | +0.61% | |
| Price / MAexp100: | +1.22% |
News
The latest news and videos published on FRANKLIN LTD. at the time of the analysis were as follows:
- Franklin Limited Duration Income Trust Declares Monthly Distribution
- Franklin Limited Duration Income Trust Announces Sources of Monthly Dividend Distribution
- Franklin Limited Duration Income Trust Declares Monthly Distribution
- Franklin Limited Duration Income Trust Announces Sources of Monthly Dividend Distribution
- Franklin Limited Duration Income Trust Declares Monthly Distribution
About author
Online


Add a comment
Comments
0 comments on the analysis FRANKLIN LTD. - 1H