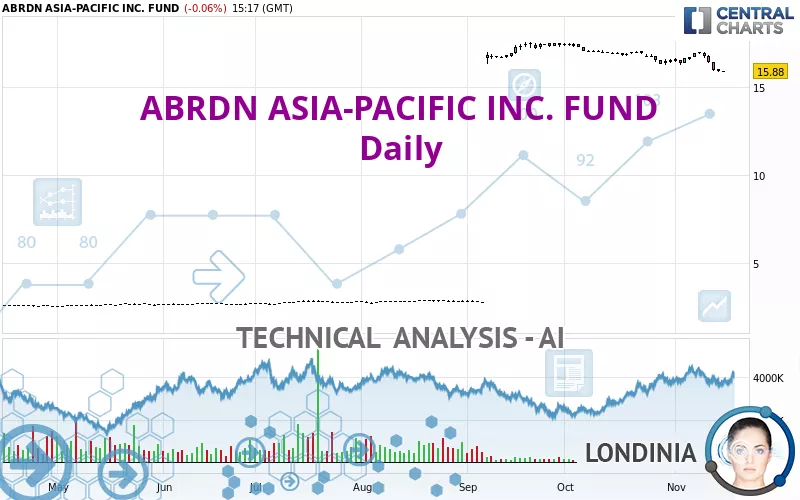
ABRDN ASIA-PACIFIC INC. FUND - Daily - Technical analysis published on 11/15/2024 (GMT)
- 110
- 0
Click here for a new analysis!
- Timeframe : Daily
- - Analysis generated on
- Status : LEVEL MAINTAINED
Summary of the analysis

Additional analysis
Quotes
ABRDN ASIA-PACIFIC INC. FUND rating 15.88 USD. The price registered a decrease of -0.06% on the session with the lowest point at 15.87 USD and the highest point at 15.91 USD. The deviation from the price is +0.06% for the low point and -0.19% for the high point.The Central Gaps scanner detects a bullish opening marking the presence of buyers ahead of sellers at the opening but not sufficiently marked to allow the price to register a quotation gap.
Bullish opening
Type : Bullish
Timeframe : Openning
So that you have an overall view of the price change, here is a table showing the variations over several periods:
Near a new HIGH record (5 years)
Type : Bullish
Timeframe : Weekly
Near a new LOW record (1 month)
Type : Bearish
Timeframe : Weekly
Technical
A technical analysis in Daily of this ABRDN ASIA-PACIFIC INC. FUND chart shows a bullish trend. 64.29% of the signals given by moving averages are bullish. Caution: the slightly bearish signals currently being given by short-term moving averages indicate that this bullish trend may be running out of steam. An assessment of moving averages reveals a bearish signal that could impact this trend:
Moving Average bearish crossovers : MA20 & MA50
Type : Bearish
Timeframe : Daily
An assessment of technical indicators does not currently provide any relevant information to suggest whether the signal given by the technical indicators is more bullish or bearish.
But beware of excesses. The Central Indicators scanner currently detects this:
CCI indicator is oversold : under -100
Type : Neutral
Timeframe : Daily
Previous candle closed under Bollinger bands
Type : Neutral
Timeframe : Daily
Williams %R indicator is oversold : under -80
Type : Neutral
Timeframe : Daily
Pivot points : price is under support 3
Type : Neutral
Timeframe : Weekly
No signals are given by Central Patterns, a market scanner specialised in chart patterns, resistances and supports.
The presence of these bullish Japanese candlestick patterns detected by Central Candlesticks that could cause a very short term rebound were also noted:
Bullish harami
Type : Bullish
Timeframe : Daily
Bullish harami cross
Type : Bullish
Timeframe : Daily
| S3 | S2 | S1 | Price | R1 | |
|---|---|---|---|---|---|
| ProTrendLines | 3.91 | 5.38 | 6.81 | 15.88 | 17.31 |
| Change (%) | -75.38% | -66.12% | -57.12% | - | +9.01% |
| Change | -11.97 | -10.50 | -9.07 | - | +1.43 |
| Level | Intermediate | Minor | Major | - | Major |
To determine price objectives, it is also possible to use the pivot points. Here is the price position in relation to pivot points:
| Pivot points | S3 | S2 | S1 | PP | R1 | R2 | R3 |
|---|---|---|---|---|---|---|---|
| Standard | 15.65 | 15.74 | 15.82 | 15.91 | 15.99 | 16.08 | 16.16 |
| Camarilla | 15.84 | 15.86 | 15.87 | 15.89 | 15.91 | 15.92 | 15.94 |
| Woodie | 15.64 | 15.74 | 15.81 | 15.91 | 15.98 | 16.08 | 16.15 |
| Fibonacci | 15.74 | 15.81 | 15.85 | 15.91 | 15.98 | 16.02 | 16.08 |
| Pivot points | S3 | S2 | S1 | PP | R1 | R2 | R3 |
|---|---|---|---|---|---|---|---|
| Standard | 15.79 | 16.03 | 16.49 | 16.73 | 17.19 | 17.43 | 17.89 |
| Camarilla | 16.77 | 16.83 | 16.90 | 16.96 | 17.02 | 17.09 | 17.15 |
| Woodie | 15.91 | 16.09 | 16.61 | 16.79 | 17.31 | 17.49 | 18.01 |
| Fibonacci | 16.03 | 16.29 | 16.46 | 16.73 | 16.99 | 17.16 | 17.43 |
| Pivot points | S3 | S2 | S1 | PP | R1 | R2 | R3 |
|---|---|---|---|---|---|---|---|
| Standard | 14.92 | 15.58 | 15.99 | 16.65 | 17.06 | 17.72 | 18.13 |
| Camarilla | 16.11 | 16.20 | 16.30 | 16.40 | 16.50 | 16.60 | 16.69 |
| Woodie | 14.80 | 15.52 | 15.87 | 16.59 | 16.94 | 17.66 | 18.01 |
| Fibonacci | 15.58 | 15.99 | 16.24 | 16.65 | 17.06 | 17.31 | 17.72 |
Numerical data
The following is the status of the technical indicators and moving averages at the time of publication of this technical analysis:
| RSI (14): | 42.92 | |
| MACD (12,26,9): | 0.1200 | |
| Directional Movement: | -13.16 | |
| AROON (14): | -21.43 | |
| DEMA (21): | 16.70 | |
| Parabolic SAR (0,02-0,02-0,2): | 16.87 | |
| Elder Ray (13): | -0.48 | |
| Super Trend (3,10): | 16.64 | |
| Zig ZAG (10): | 15.90 | |
| VORTEX (21): | 0.8400 | |
| Stochastique (14,3,5): | 5.48 | |
| TEMA (21): | 15.86 | |
| Williams %R (14): | -94.83 | |
| Chande Momentum Oscillator (20): | -0.56 | |
| Repulse (5,40,3): | -2.6400 | |
| ROCnROLL: | -1 | |
| TRIX (15,9): | 0.2200 | |
| Courbe Coppock: | 3.77 |
| MA7: | 16.39 | |
| MA20: | 16.53 | |
| MA50: | 16.75 | |
| MA100: | 9.72 | |
| MAexp7: | 16.22 | |
| MAexp20: | 16.38 | |
| MAexp50: | 14.75 | |
| MAexp100: | 11.52 | |
| Price / MA7: | -3.11% | |
| Price / MA20: | -3.93% | |
| Price / MA50: | -5.19% | |
| Price / MA100: | +63.37% | |
| Price / MAexp7: | -2.10% | |
| Price / MAexp20: | -3.05% | |
| Price / MAexp50: | +7.66% | |
| Price / MAexp100: | +37.85% |
News
The last news published on ABRDN ASIA-PACIFIC INC. FUND at the time of the generation of this analysis was as follows:
- Aberdeen Standard Investments Inc. Announces Director Appointment and Director Resignation for US Funds
- Aberdeen Asia-Pacific Income Fund, Inc. Announces Payment Of Monthly Distribution
- Aberdeen Asia-Pacific Income Fund, Inc. Announces Performance Data And Portfolio Composition
- Aberdeen Asia-Pacific Income Fund, Inc. Announces Record Date And Payment Date For Monthly Distribution
- Aberdeen Asia-Pacific Income Fund, Inc. Announces Payment Of Monthly Distribution
About author
Online


Add a comment
Comments
0 comments on the analysis ABRDN ASIA-PACIFIC INC. FUND - Daily