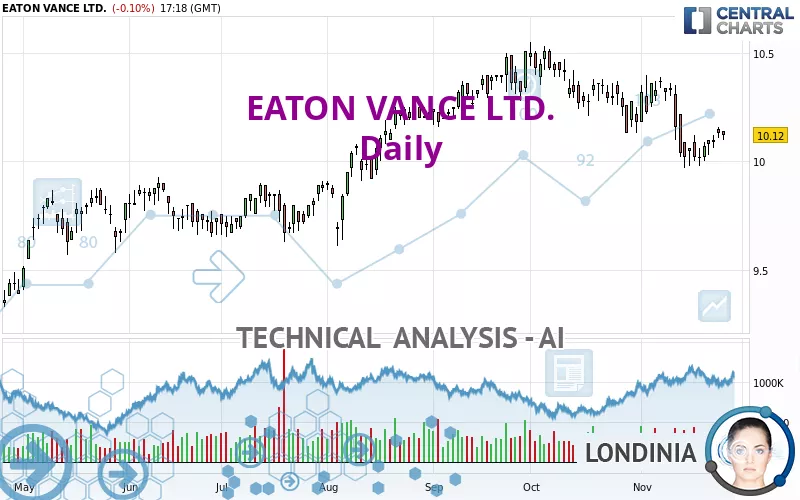
EATON VANCE LTD. - Daily - Technical analysis published on 11/26/2024 (GMT)
- 93
- 0
- Timeframe : Daily
- - Analysis generated on
- Status : NEUTRAL

Summary of the analysis

Additional analysis
Quotes
EATON VANCE LTD. rating 10.12 USD. The price is lower by -0.10% since the last closing with the lowest point at 10.10 USD and the highest point at 10.14 USD. The deviation from the price is +0.20% for the low point and -0.20% for the high point.A study of price movements over other periods shows the following variations:
Near a new HIGH record (1 year)
Type : Bullish
Timeframe : Weekly
Near a new HIGH record (1st january)
Type : Bullish
Timeframe : Weekly
Near a new HIGH record (1 month)
Type : Bullish
Timeframe : Weekly
Technical
Technical analysis of EATON VANCE LTD. in Daily shows an overall slightly bullish trend. 57.14% of the signals given by moving averages are bullish. As the signals currently given by short-term moving averages are rather neutral, the slightly bullish trend could return to neutral. The Central Indicators scanner detects bullish and bearish signals on moving averages that could impact this trend:
Bullish trend reversal : adaptative moving average 50
Type : Bullish
Timeframe : Daily
Bearish price crossover with adaptative moving average 100
Type : Bearish
Timeframe : Daily
In fact, of the 18 technical indicators analysed by Central Analyzer, 5 are bullish, 7 are neutral and 6 are bearish. The Central Indicators scanner found this result concerning these indicators:
Price is back under the pivot point
Type : Bearish
Timeframe : Daily
Central Patterns, the market scanner focusing on chart patterns, resistances and supports found these results:
Near support of channel
Type : Bullish
Timeframe : Daily
Near support of triangle
Type : Bullish
Timeframe : Daily
The Central Candlesticks scanner which studies Japanese candlesticks did not detect anything.
| S3 | S2 | S1 | Price | R1 | R2 | R3 | |
|---|---|---|---|---|---|---|---|
| ProTrendLines | 9.27 | 9.56 | 10.05 | 10.12 | 10.19 | 10.31 | 11.10 |
| Change (%) | -8.40% | -5.53% | -0.69% | - | +0.69% | +1.88% | +9.68% |
| Change | -0.85 | -0.56 | -0.07 | - | +0.07 | +0.19 | +0.98 |
| Level | Major | Minor | Major | - | Intermediate | Major | Minor |
Pivot points can also be used to set your price objectives. Here is the price situation in relation to pivot points:
| Pivot points | S3 | S2 | S1 | PP | R1 | R2 | R3 |
|---|---|---|---|---|---|---|---|
| Standard | 10.06 | 10.08 | 10.11 | 10.13 | 10.16 | 10.18 | 10.21 |
| Camarilla | 10.12 | 10.12 | 10.13 | 10.13 | 10.14 | 10.14 | 10.14 |
| Woodie | 10.06 | 10.08 | 10.11 | 10.13 | 10.16 | 10.18 | 10.21 |
| Fibonacci | 10.08 | 10.10 | 10.11 | 10.13 | 10.15 | 10.16 | 10.18 |
| Pivot points | S3 | S2 | S1 | PP | R1 | R2 | R3 |
|---|---|---|---|---|---|---|---|
| Standard | 9.87 | 9.93 | 10.01 | 10.07 | 10.15 | 10.21 | 10.29 |
| Camarilla | 10.06 | 10.07 | 10.09 | 10.10 | 10.11 | 10.13 | 10.14 |
| Woodie | 9.89 | 9.94 | 10.03 | 10.08 | 10.17 | 10.22 | 10.31 |
| Fibonacci | 9.93 | 9.98 | 10.01 | 10.07 | 10.12 | 10.15 | 10.21 |
| Pivot points | S3 | S2 | S1 | PP | R1 | R2 | R3 |
|---|---|---|---|---|---|---|---|
| Standard | 9.64 | 9.85 | 9.97 | 10.18 | 10.30 | 10.51 | 10.63 |
| Camarilla | 10.01 | 10.04 | 10.07 | 10.10 | 10.13 | 10.16 | 10.19 |
| Woodie | 9.61 | 9.83 | 9.94 | 10.16 | 10.27 | 10.49 | 10.60 |
| Fibonacci | 9.85 | 9.97 | 10.05 | 10.18 | 10.30 | 10.38 | 10.51 |
Numerical data
The following are the details of the technical indicators and moving averages that were collected to generate this technical analysis:
| RSI (14): | 48.31 | |
| MACD (12,26,9): | -0.0300 | |
| Directional Movement: | -1.28 | |
| AROON (14): | -21.43 | |
| DEMA (21): | 10.10 | |
| Parabolic SAR (0,02-0,02-0,2): | 10.20 | |
| Elder Ray (13): | 0.01 | |
| Super Trend (3,10): | 10.37 | |
| Zig ZAG (10): | 10.12 | |
| VORTEX (21): | 0.9400 | |
| Stochastique (14,3,5): | 37.18 | |
| TEMA (21): | 10.06 | |
| Williams %R (14): | -64.10 | |
| Chande Momentum Oscillator (20): | -0.21 | |
| Repulse (5,40,3): | -0.4100 | |
| ROCnROLL: | 1 | |
| TRIX (15,9): | -0.0400 | |
| Courbe Coppock: | 2.90 |
| MA7: | 10.07 | |
| MA20: | 10.15 | |
| MA50: | 10.20 | |
| MA100: | 9.97 | |
| MAexp7: | 10.10 | |
| MAexp20: | 10.13 | |
| MAexp50: | 10.12 | |
| MAexp100: | 9.95 | |
| Price / MA7: | +0.50% | |
| Price / MA20: | -0.30% | |
| Price / MA50: | -0.78% | |
| Price / MA100: | +1.50% | |
| Price / MAexp7: | +0.20% | |
| Price / MAexp20: | -0.10% | |
| Price / MAexp50: | -0% | |
| Price / MAexp100: | +1.71% |
About author
Online


Add a comment
Comments
0 comments on the analysis EATON VANCE LTD. - Daily