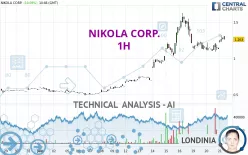
NIKOLA CORP. - 1H - Technical analysis published on 06/21/2023 (GMT)
- 165
- 0
Click here for a new analysis!
- Timeframe : 1H
- - Analysis generated on
- Status : INVALID

Summary of the analysis
Additional analysis
Quotes
NIKOLA CORP. rating 1.263 EUR. The price has increased by +10.69% since the last closing with the lowest point at 1.220 EUR and the highest point at 1.323 EUR. The deviation from the price is +3.52% for the low point and -4.54% for the high point.A bullish gap was detected at the opening by the Central Gaps scanner. There are a lot of buyers and they have the upper hand in the very short term.
Opening Gap UP
Type : Bullish
Timeframe : Openning
A study of price movements over other periods shows the following variations:
Abnormal volumes
Timeframe : 5 days
Abnormal volumes
Timeframe : 20 days
Abnormal volumes
Timeframe : 50 days
Technical
Technical analysis of NIKOLA CORP. in 1H shows a strongly overall bullish trend. 85.71% of the signals given by moving averages are bullish. The slightly bullish signals given by the short-term moving averages indicate this trend is showing signs of running out of steam. The Central Indicators scanner does not detect any result on moving averages that would impact this trend.
An assessment of technical indicators shows a strong bullish signal.
Caution: the Central Indicators scanner currently detects an excess:
CCI indicator is overbought : over 100
Type : Neutral
Timeframe : 1 hour
Williams %R indicator is overbought : over -20
Type : Neutral
Timeframe : 1 hour
Pivot points : price is over resistance 2
Type : Neutral
Timeframe : 1 hour
SuperTrend indicator bullish reversal
Type : Bullish
Timeframe : 1 hour
Price is back over the pivot point
Type : Bullish
Timeframe : Weekly
Central Patterns, the market scanner focusing on chart patterns, resistances and supports found this result:
Resistance of channel is broken
Type : Bullish
Timeframe : 1 hour
No result was found by the Central Candlesticks scanner on Japanese candlesticks.
| S3 | S2 | S1 | Price | R1 | R2 | R3 | |
|---|---|---|---|---|---|---|---|
| ProTrendLines | 0.765 | 1.131 | 1.218 | 1.263 | 1.626 | 1.998 | 2.718 |
| Change (%) | -39.43% | -10.45% | -3.56% | - | +28.74% | +58.19% | +115.20% |
| Change | -0.498 | -0.132 | -0.045 | - | +0.363 | +0.735 | +1.455 |
| Level | Major | Minor | Minor | - | Major | Intermediate | Intermediate |
To determine price objectives, it is also possible to use the pivot points. Here is the price position in relation to pivot points:
| Pivot points | S3 | S2 | S1 | PP | R1 | R2 | R3 |
|---|---|---|---|---|---|---|---|
| Standard | 0.955 | 1.022 | 1.082 | 1.149 | 1.209 | 1.276 | 1.336 |
| Camarilla | 1.106 | 1.118 | 1.129 | 1.141 | 1.153 | 1.164 | 1.176 |
| Woodie | 0.951 | 1.020 | 1.078 | 1.147 | 1.205 | 1.274 | 1.332 |
| Fibonacci | 1.022 | 1.071 | 1.101 | 1.149 | 1.198 | 1.228 | 1.276 |
| Pivot points | S3 | S2 | S1 | PP | R1 | R2 | R3 |
|---|---|---|---|---|---|---|---|
| Standard | -0.268 | 0.194 | 0.702 | 1.164 | 1.672 | 2.134 | 2.642 |
| Camarilla | 0.943 | 1.032 | 1.121 | 1.210 | 1.299 | 1.388 | 1.477 |
| Woodie | -0.245 | 0.206 | 0.725 | 1.176 | 1.695 | 2.146 | 2.665 |
| Fibonacci | 0.194 | 0.565 | 0.794 | 1.164 | 1.535 | 1.764 | 2.134 |
| Pivot points | S3 | S2 | S1 | PP | R1 | R2 | R3 |
|---|---|---|---|---|---|---|---|
| Standard | -0.024 | 0.249 | 0.411 | 0.684 | 0.846 | 1.119 | 1.281 |
| Camarilla | 0.452 | 0.492 | 0.532 | 0.572 | 0.612 | 0.652 | 0.692 |
| Woodie | -0.081 | 0.221 | 0.355 | 0.656 | 0.790 | 1.091 | 1.225 |
| Fibonacci | 0.249 | 0.416 | 0.518 | 0.684 | 0.851 | 0.953 | 1.119 |
Numerical data
The following is the status of technical indicators and moving averages registered at the time this technical analysis was created:
| RSI (14): | 61.42 | |
| MACD (12,26,9): | 0.0190 | |
| Directional Movement: | 20.684 | |
| AROON (14): | 28.571 | |
| DEMA (21): | 1.229 | |
| Parabolic SAR (0,02-0,02-0,2): | 1.125 | |
| Elder Ray (13): | 0.085 | |
| Super Trend (3,10): | 1.113 | |
| Zig ZAG (10): | 1.308 | |
| VORTEX (21): | 1.0160 | |
| Stochastique (14,3,5): | 83.83 | |
| TEMA (21): | 1.207 | |
| Williams %R (14): | -6.44 | |
| Chande Momentum Oscillator (20): | 0.185 | |
| Repulse (5,40,3): | 2.1860 | |
| ROCnROLL: | 1 | |
| TRIX (15,9): | -0.0170 | |
| Courbe Coppock: | 9.54 |
| MA7: | 1.138 | |
| MA20: | 0.767 | |
| MA50: | 0.775 | |
| MA100: | 1.319 | |
| MAexp7: | 1.236 | |
| MAexp20: | 1.206 | |
| MAexp50: | 1.127 | |
| MAexp100: | 0.984 | |
| Price / MA7: | +10.98% | |
| Price / MA20: | +64.67% | |
| Price / MA50: | +62.97% | |
| Price / MA100: | -4.25% | |
| Price / MAexp7: | +2.18% | |
| Price / MAexp20: | +4.73% | |
| Price / MAexp50: | +12.07% | |
| Price / MAexp100: | +28.35% |
About author

Online


Add a comment
Comments
0 comments on the analysis NIKOLA CORP. - 1H