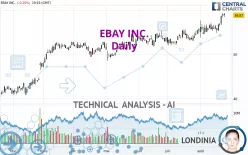
EBAY INC. - Daily - Technical analysis published on 08/23/2024 (GMT)
- 135
- 0
Click here for a new analysis!
- Timeframe : Daily
- - Analysis generated on
- Status : TARGET REACHED

Summary of the analysis

Additional analysis
Quotes
EBAY INC. rating 58.88 USD. The price registered a decrease of -0.24% on the session with the lowest point at 58.48 USD and the highest point at 59.30 USD. The deviation from the price is +0.68% for the low point and -0.71% for the high point.The Central Gaps scanner detects a bullish opening. A small advantage for buyers in the very short term.
Bullish opening
Type : Bullish
Timeframe : Openning
A study of price movements over other periods shows the following variations:
Near a new HIGH record (1 year)
Type : Bullish
Timeframe : Weekly
Near a new HIGH record (1st january)
Type : Bullish
Timeframe : Weekly
Near a new HIGH record (1 month)
Type : Bullish
Timeframe : Weekly
Technical
Technical analysis of EBAY INC. in Daily shows a strongly overall bullish trend. 92.86% of the signals given by moving averages are bullish. This strongly bullish trend is supported by the strong bullish signals given by short-term moving averages. The Central Indicators scanner does not detect any result on moving averages that would impact this trend.
In fact, according to the parameters integrated into the Central Analyzer system, 16 technical indicators out of 18 analysed are currently bullish. Caution: the Central Indicators scanner currently detects an excess:
CCI indicator is overbought : over 100
Type : Neutral
Timeframe : Daily
Previous candle closed over Bollinger bands
Type : Neutral
Timeframe : Daily
Williams %R indicator is overbought : over -20
Type : Neutral
Timeframe : Daily
Pivot points : price is over resistance 2
Type : Neutral
Timeframe : Weekly
Price is back under the pivot point
Type : Bearish
Timeframe : Daily
The Central Patterns scanner, which studies chart patterns, resistances and supports, has identified this signal:
Near horizontal resistance
Type : Bearish
Timeframe : Daily
The presence of a bearish pattern in Japanese candlesticks detected by Central Candlesticks that could cause a correction in the very short term was also detected:
Bearish engulfing lines
Type : Bearish
Timeframe : Daily
| S3 | S2 | S1 | Price | R1 | R2 | R3 | |
|---|---|---|---|---|---|---|---|
| ProTrendLines | 47.95 | 52.52 | 54.55 | 58.88 | 61.71 | 64.81 | 76.28 |
| Change (%) | -18.56% | -10.80% | -7.35% | - | +4.81% | +10.07% | +29.55% |
| Change | -10.93 | -6.36 | -4.33 | - | +2.83 | +5.93 | +17.40 |
| Level | Major | Major | Major | - | Minor | Minor | Major |
Attention could also be paid to pivot points to set price objectives:
| Pivot points | S3 | S2 | S1 | PP | R1 | R2 | R3 |
|---|---|---|---|---|---|---|---|
| Standard | 57.38 | 57.85 | 58.43 | 58.90 | 59.48 | 59.95 | 60.53 |
| Camarilla | 58.73 | 58.83 | 58.92 | 59.02 | 59.12 | 59.21 | 59.31 |
| Woodie | 57.45 | 57.88 | 58.50 | 58.93 | 59.55 | 59.98 | 60.60 |
| Fibonacci | 57.85 | 58.25 | 58.50 | 58.90 | 59.30 | 59.55 | 59.95 |
| Pivot points | S3 | S2 | S1 | PP | R1 | R2 | R3 |
|---|---|---|---|---|---|---|---|
| Standard | 52.09 | 53.45 | 54.47 | 55.83 | 56.85 | 58.21 | 59.23 |
| Camarilla | 54.85 | 55.06 | 55.28 | 55.50 | 55.72 | 55.94 | 56.16 |
| Woodie | 51.93 | 53.37 | 54.31 | 55.75 | 56.69 | 58.13 | 59.07 |
| Fibonacci | 53.45 | 54.36 | 54.92 | 55.83 | 56.74 | 57.30 | 58.21 |
| Pivot points | S3 | S2 | S1 | PP | R1 | R2 | R3 |
|---|---|---|---|---|---|---|---|
| Standard | 49.31 | 50.67 | 53.14 | 54.50 | 56.97 | 58.33 | 60.80 |
| Camarilla | 54.56 | 54.91 | 55.26 | 55.61 | 55.96 | 56.31 | 56.66 |
| Woodie | 49.87 | 50.95 | 53.70 | 54.78 | 57.53 | 58.61 | 61.36 |
| Fibonacci | 50.67 | 52.13 | 53.04 | 54.50 | 55.96 | 56.87 | 58.33 |
Numerical data
The following is the status of the technical indicators and moving averages at the time of publication of this technical analysis:
| RSI (14): | 67.82 | |
| MACD (12,26,9): | 1.0500 | |
| Directional Movement: | 21.49 | |
| AROON (14): | 92.86 | |
| DEMA (21): | 57.66 | |
| Parabolic SAR (0,02-0,02-0,2): | 55.49 | |
| Elder Ray (13): | 1.93 | |
| Super Trend (3,10): | 55.04 | |
| Zig ZAG (10): | 58.74 | |
| VORTEX (21): | 1.1600 | |
| Stochastique (14,3,5): | 92.50 | |
| TEMA (21): | 58.16 | |
| Williams %R (14): | -12.50 | |
| Chande Momentum Oscillator (20): | 3.64 | |
| Repulse (5,40,3): | 1.9600 | |
| ROCnROLL: | 1 | |
| TRIX (15,9): | 0.2000 | |
| Courbe Coppock: | 7.73 |
| MA7: | 57.35 | |
| MA20: | 56.24 | |
| MA50: | 54.65 | |
| MA100: | 53.12 | |
| MAexp7: | 57.72 | |
| MAexp20: | 56.38 | |
| MAexp50: | 54.90 | |
| MAexp100: | 52.97 | |
| Price / MA7: | +2.67% | |
| Price / MA20: | +4.69% | |
| Price / MA50: | +7.74% | |
| Price / MA100: | +10.84% | |
| Price / MAexp7: | +2.01% | |
| Price / MAexp20: | +4.43% | |
| Price / MAexp50: | +7.25% | |
| Price / MAexp100: | +11.16% |
News
The last news published on EBAY INC. at the time of the generation of this analysis was as follows:
- eBay Inc. Reports Second Quarter 2024 Results
- eBay Seller Capital and Liberis Partner to Accelerate Small Business Growth
- Elton John Partners with eBay to Release a Personal Collection of Pre-loved Fashion in Support of Elton John AIDS Foundation
- Collectors and eBay Transactions Close, Summer Launch Expected for Integrated, End-to-End Hobby Experience
- eBay Announces Inaugural 'Recommerce Day' to Celebrate Pre-Loved Shopping
About author
Online


Add a comment
Comments
0 comments on the analysis EBAY INC. - Daily