EBAY INC. overview
EBAY INC.
> Analyses

 Thank you
Reply
Chart
Thank you
Reply
Chart
Londinia
has published a new analysis.
- 0
- 89131
- 15463
- 0
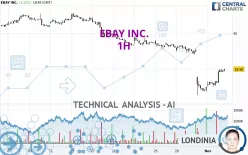
Timeframe : 1H - Simple chart
Status : TARGET REACHED
The bullish trend is currently very strong on EBAY INC.. As long as the price remains above the support at 66.89 USD, you could try to benefit from the boom. The first bullish objective is located at…
EBAY INC.
> Analyses
 Thank you
Reply
Chart
Thank you
Reply
Chart
Londinia
has published a new analysis.
- 0
- 89131
- 15463
- 0
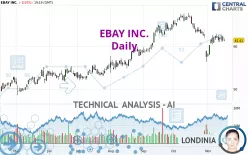
Timeframe : Daily - Simple chart
Status : LEVEL MAINTAINED
The current short-term bearish trend is expected to quickly reset the neutral or bearish trend. To avoid contradicting the short term, it would be possible to favour short positions (for sale) for…
EBAY INC.
> Analyses
 Thank you
Reply
Chart
Thank you
Reply
Chart
Londinia
has published a new analysis.
- 0
- 89131
- 15463
- 0
Timeframe : 1H - Simple chart
Status : INVALID
Has the basic bearish trend slowed or is it lacking in power? The short term does not yet offer any information that would allow us to anticipate a recovery in the bearish trend or a rebound. Sellers'…

