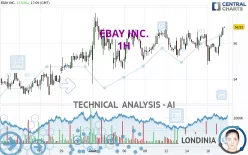
EBAY INC. - 1H - Technical analysis published on 08/19/2024 (GMT)
- 140
- 0
Click here for a new analysis!
- Timeframe : 1H
- - Analysis generated on
- Status : TARGET REACHED

Summary of the analysis

Additional analysis
Quotes
The EBAY INC. rating is 56.91 USD. The price has increased by +2.54% since the last closing and was traded between 55.29 USD and 56.94 USD over the period. The price is currently at +2.93% from its lowest and -0.05% from its highest.The Central Gaps scanner detects a bearish opening. A small advantage for sellers in the very short term.
Bearish opening
Type : Bearish
Timeframe : Openning
A study of price movements over other periods shows the following variations:
Near a new HIGH record (1 year)
Type : Bullish
Timeframe : Weekly
Near a new HIGH record (1st january)
Type : Bullish
Timeframe : Weekly
Near a new LOW record (1 month)
Type : Bearish
Timeframe : Weekly
Technical
Technical analysis of this 1H chart of EBAY INC. indicates that the overall trend is strongly bullish. 89.29% of the signals given by moving averages are bullish. This strongly bullish trend is supported by the strong bullish signals given by short-term moving averages. The Central Indicators scanner does not detect any result on moving averages that would impact this trend.
The probability of a further increase is high given the direction of the technical indicators.
Caution: the Central Indicators scanner currently detects an excess:
CCI indicator is overbought : over 100
Type : Neutral
Timeframe : 1 hour
Williams %R indicator is overbought : over -20
Type : Neutral
Timeframe : 1 hour
Pivot points : price is over resistance 2
Type : Neutral
Timeframe : 1 hour
Price is back over the pivot point
Type : Bullish
Timeframe : Weekly
Central Patterns, the market scanner focusing on chart patterns, resistances and supports found these results:
Near horizontal resistance
Type : Bearish
Timeframe : 1 hour
Near resistance of triangle
Type : Bearish
Timeframe : 1 hour
Resistance of channel is broken
Type : Bullish
Timeframe : 1 hour
No result was found by the Central Candlesticks scanner on Japanese candlesticks.
| S3 | S2 | S1 | Price | R1 | R2 | R3 | |
|---|---|---|---|---|---|---|---|
| ProTrendLines | 55.25 | 55.69 | 56.52 | 56.91 | 57.18 | 57.68 | 61.71 |
| Change (%) | -2.92% | -2.14% | -0.69% | - | +0.47% | +1.35% | +8.43% |
| Change | -1.66 | -1.22 | -0.39 | - | +0.27 | +0.77 | +4.80 |
| Level | Minor | Intermediate | Major | - | Minor | Minor | Minor |
Pivot points can also be used to set your price objectives. Here is the price situation in relation to pivot points:
| Pivot points | S3 | S2 | S1 | PP | R1 | R2 | R3 |
|---|---|---|---|---|---|---|---|
| Standard | 53.67 | 54.23 | 54.87 | 55.43 | 56.07 | 56.63 | 57.27 |
| Camarilla | 55.17 | 55.28 | 55.39 | 55.50 | 55.61 | 55.72 | 55.83 |
| Woodie | 53.70 | 54.25 | 54.90 | 55.45 | 56.10 | 56.65 | 57.30 |
| Fibonacci | 54.23 | 54.69 | 54.98 | 55.43 | 55.89 | 56.18 | 56.63 |
| Pivot points | S3 | S2 | S1 | PP | R1 | R2 | R3 |
|---|---|---|---|---|---|---|---|
| Standard | 52.09 | 53.45 | 54.47 | 55.83 | 56.85 | 58.21 | 59.23 |
| Camarilla | 54.85 | 55.06 | 55.28 | 55.50 | 55.72 | 55.94 | 56.16 |
| Woodie | 51.93 | 53.37 | 54.31 | 55.75 | 56.69 | 58.13 | 59.07 |
| Fibonacci | 53.45 | 54.36 | 54.92 | 55.83 | 56.74 | 57.30 | 58.21 |
| Pivot points | S3 | S2 | S1 | PP | R1 | R2 | R3 |
|---|---|---|---|---|---|---|---|
| Standard | 49.31 | 50.67 | 53.14 | 54.50 | 56.97 | 58.33 | 60.80 |
| Camarilla | 54.56 | 54.91 | 55.26 | 55.61 | 55.96 | 56.31 | 56.66 |
| Woodie | 49.87 | 50.95 | 53.70 | 54.78 | 57.53 | 58.61 | 61.36 |
| Fibonacci | 50.67 | 52.13 | 53.04 | 54.50 | 55.96 | 56.87 | 58.33 |
Numerical data
The following is the status of technical indicators and moving averages registered at the time this technical analysis was created:
| RSI (14): | 61.92 | |
| MACD (12,26,9): | 0.1300 | |
| Directional Movement: | 4.28 | |
| AROON (14): | 78.57 | |
| DEMA (21): | 56.25 | |
| Parabolic SAR (0,02-0,02-0,2): | 55.02 | |
| Elder Ray (13): | 0.68 | |
| Super Trend (3,10): | 55.70 | |
| Zig ZAG (10): | 56.88 | |
| VORTEX (21): | 1.1000 | |
| Stochastique (14,3,5): | 96.26 | |
| TEMA (21): | 56.38 | |
| Williams %R (14): | 0.00 | |
| Chande Momentum Oscillator (20): | 1.09 | |
| Repulse (5,40,3): | 1.2500 | |
| ROCnROLL: | 1 | |
| TRIX (15,9): | 0.0000 | |
| Courbe Coppock: | 0.86 |
| MA7: | 56.01 | |
| MA20: | 55.29 | |
| MA50: | 54.24 | |
| MA100: | 52.86 | |
| MAexp7: | 56.41 | |
| MAexp20: | 56.13 | |
| MAexp50: | 56.00 | |
| MAexp100: | 55.70 | |
| Price / MA7: | +1.61% | |
| Price / MA20: | +2.93% | |
| Price / MA50: | +4.92% | |
| Price / MA100: | +7.66% | |
| Price / MAexp7: | +0.89% | |
| Price / MAexp20: | +1.39% | |
| Price / MAexp50: | +1.63% | |
| Price / MAexp100: | +2.17% |
News
The last news published on EBAY INC. at the time of the generation of this analysis was as follows:
- eBay Inc. Reports Second Quarter 2024 Results
- eBay Seller Capital and Liberis Partner to Accelerate Small Business Growth
- Elton John Partners with eBay to Release a Personal Collection of Pre-loved Fashion in Support of Elton John AIDS Foundation
- Collectors and eBay Transactions Close, Summer Launch Expected for Integrated, End-to-End Hobby Experience
- eBay Announces Inaugural 'Recommerce Day' to Celebrate Pre-Loved Shopping
About author
Online


Add a comment
Comments
0 comments on the analysis EBAY INC. - 1H