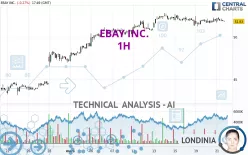
EBAY INC. - 1H - Technical analysis published on 03/21/2024 (GMT)
- 185
- 0
Click here for a new analysis!
- Timeframe : 1H
- - Analysis generated on
- Status : LEVEL MAINTAINED

Summary of the analysis

Additional analysis
Quotes
The EBAY INC. price is 51.92 USD. On the day, this instrument lost -0.10% and was traded between 51.68 USD and 52.35 USD over the period. The price is currently at +0.46% from its lowest and -0.82% from its highest.The Central Gaps scanner detects a bearish opening. A small advantage for sellers in the very short term.
Bearish opening
Type : Bearish
Timeframe : Openning
A study of price movements over other periods shows the following variations:
Near a new HIGH record (1 year)
Type : Bullish
Timeframe : Weekly
Near a new HIGH record (1st january)
Type : Bullish
Timeframe : Weekly
Near a new HIGH record (1 month)
Type : Bullish
Timeframe : Weekly
Technical
A technical analysis in 1H of this EBAY INC. chart shows a bullish trend. 71.43% of the signals given by moving averages are bullish. Caution: the neutral signals currently given by short-term moving averages show us that the global trend is losing momentum. An assessment of moving averages reveals several bearish signals that could impact this trend:
Bearish price crossover with Moving Average 50
Type : Bearish
Timeframe : 1 hour
Bearish price crossover with adaptative moving average 50
Type : Bearish
Timeframe : 1 hour
An assessment of technical indicators does not currently provide any relevant information to suggest whether the signal given by the technical indicators is more bullish or bearish.
Central Indicators, the detector scanner for these technical indicators has recently detected several signals:
Price is back under the pivot point
Type : Bearish
Timeframe : 1 hour
Momentum indicator is back over 0
Type : Bullish
Timeframe : 1 hour
The Central Patterns scanner, which studies chart patterns, resistances and supports, has identified these signals:
Near horizontal support
Type : Bullish
Timeframe : 1 hour
Support of channel is broken
Type : Bearish
Timeframe : 1 hour
Central Candlesticks, the scanner specialised in Japanese candlesticks, detects a bearish signal that could support the hypothesis of a small drop in the very short term:
Bearish engulfing lines
Type : Bearish
Timeframe : 1 hour
| S3 | S2 | S1 | Price | R1 | R2 | R3 | |
|---|---|---|---|---|---|---|---|
| ProTrendLines | 43.62 | 48.20 | 50.77 | 51.92 | 52.41 | 55.54 | 62.02 |
| Change (%) | -15.99% | -7.16% | -2.21% | - | +0.94% | +6.97% | +19.45% |
| Change | -8.30 | -3.72 | -1.15 | - | +0.49 | +3.62 | +10.10 |
| Level | Major | Major | Intermediate | - | Major | Intermediate | Minor |
To determine price objectives, it is also possible to use the pivot points. Here is the price position in relation to pivot points:
| Pivot points | S3 | S2 | S1 | PP | R1 | R2 | R3 |
|---|---|---|---|---|---|---|---|
| Standard | 50.95 | 51.28 | 51.62 | 51.95 | 52.29 | 52.62 | 52.96 |
| Camarilla | 51.79 | 51.85 | 51.91 | 51.97 | 52.03 | 52.09 | 52.15 |
| Woodie | 50.97 | 51.28 | 51.64 | 51.95 | 52.31 | 52.62 | 52.98 |
| Fibonacci | 51.28 | 51.53 | 51.69 | 51.95 | 52.20 | 52.36 | 52.62 |
| Pivot points | S3 | S2 | S1 | PP | R1 | R2 | R3 |
|---|---|---|---|---|---|---|---|
| Standard | 48.34 | 49.36 | 50.78 | 51.80 | 53.22 | 54.24 | 55.66 |
| Camarilla | 51.53 | 51.75 | 51.98 | 52.20 | 52.42 | 52.65 | 52.87 |
| Woodie | 48.54 | 49.46 | 50.98 | 51.90 | 53.42 | 54.34 | 55.86 |
| Fibonacci | 49.36 | 50.29 | 50.87 | 51.80 | 52.73 | 53.31 | 54.24 |
| Pivot points | S3 | S2 | S1 | PP | R1 | R2 | R3 |
|---|---|---|---|---|---|---|---|
| Standard | 34.77 | 37.64 | 42.34 | 45.21 | 49.91 | 52.78 | 57.48 |
| Camarilla | 44.95 | 45.64 | 46.34 | 47.03 | 47.72 | 48.42 | 49.11 |
| Woodie | 35.68 | 38.10 | 43.25 | 45.67 | 50.82 | 53.24 | 58.39 |
| Fibonacci | 37.64 | 40.54 | 42.32 | 45.21 | 48.11 | 49.89 | 52.78 |
Numerical data
The following is the status of the technical indicators and moving averages at the time of publication of this technical analysis:
| RSI (14): | 49.87 | |
| MACD (12,26,9): | 0.0300 | |
| Directional Movement: | 4.90 | |
| AROON (14): | 42.86 | |
| DEMA (21): | 51.98 | |
| Parabolic SAR (0,02-0,02-0,2): | 51.43 | |
| Elder Ray (13): | -0.03 | |
| Super Trend (3,10): | 52.71 | |
| Zig ZAG (10): | 51.93 | |
| VORTEX (21): | 0.9700 | |
| Stochastique (14,3,5): | 49.05 | |
| TEMA (21): | 51.94 | |
| Williams %R (14): | -54.97 | |
| Chande Momentum Oscillator (20): | 0.15 | |
| Repulse (5,40,3): | 0.0300 | |
| ROCnROLL: | 1 | |
| TRIX (15,9): | 0.0000 | |
| Courbe Coppock: | 0.88 |
| MA7: | 52.00 | |
| MA20: | 49.50 | |
| MA50: | 44.92 | |
| MA100: | 42.98 | |
| MAexp7: | 51.99 | |
| MAexp20: | 51.93 | |
| MAexp50: | 51.67 | |
| MAexp100: | 50.54 | |
| Price / MA7: | -0.15% | |
| Price / MA20: | +4.89% | |
| Price / MA50: | +15.58% | |
| Price / MA100: | +20.80% | |
| Price / MAexp7: | -0.13% | |
| Price / MAexp20: | -0.02% | |
| Price / MAexp50: | +0.48% | |
| Price / MAexp100: | +2.73% |
News
The last news published on EBAY INC. at the time of the generation of this analysis was as follows:
- eBay Inc. Reports Fourth Quarter and Full Year 2023 Results
-
 Look ahead: Japan inflation; German and US consumer confidence; Puma; eBay
-
Week ahead: Consumer confidence; Core PCE; Retail sales; Ocado; Taylor Wimpey; eBay
-
Week ahead: Consumer confidence; Core PCE; Retail sales; Ocado; Taylor Wimpey; eBay
-
Week ahead: Consumer confidence; Core PCE; Retail sales; Ocado; Taylor Wimpey; eBay
About author
Online


Add a comment
Comments
0 comments on the analysis EBAY INC. - 1H