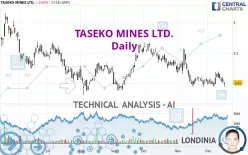
TASEKO MINES LTD. - Daily - Technical analysis published on 12/17/2024 (GMT)
- 63
- 0
Click here for a new analysis!
- Timeframe : Daily
- - Analysis generated on
- Status : INVALID

Summary of the analysis

Additional analysis
Quotes
TASEKO MINES LTD. rating 2.01 USD. On the day, this instrument lost -0.50% and was between 1.94 USD and 2.02 USD. This implies that the price is at +3.61% from its lowest and at -0.50% from its highest.A bearish gap was detected at the opening by the Central Gaps scanner. There are a lot of sellers and they have the upper hand in the very short term.
Opening Gap DOWN
Type : Bearish
Timeframe : Openning
A study of price movements over other periods shows the following variations:
New LOW record (1 month)
Type : Bearish
Timeframe : Weekly
Technical
Technical analysis of TASEKO MINES LTD. in Daily shows a overall strongly bearish trend. 89.29% of the signals given by moving averages are bearish. This strongly bearish trend is supported by the strong bearish signals given by short-term moving averages. The Central Indicators market scanner currently does not detect any result that concerns moving averages.
The technical indicators are generally neutral. They do not provide relevant information on the direction of future price movements.
Caution: the Central Indicators scanner currently detects an excess:
CCI indicator is oversold : under -100
Type : Neutral
Timeframe : Daily
Williams %R indicator is oversold : under -80
Type : Neutral
Timeframe : Daily
Parabolic SAR indicator bearish reversal
Type : Bearish
Timeframe : Daily
Momentum indicator is back under 0
Type : Bearish
Timeframe : Daily
Central Patterns, the market scanner focusing on chart patterns, resistances and supports found these results:
Near horizontal support
Type : Bullish
Timeframe : Daily
Support of channel is broken
Type : Bearish
Timeframe : Daily
The Central Candlesticks scanner which studies Japanese candlesticks did not detect anything.
| S3 | S2 | S1 | Price | R1 | R2 | R3 | |
|---|---|---|---|---|---|---|---|
| ProTrendLines | 1.07 | 1.51 | 1.82 | 2.01 | 2.05 | 2.39 | 2.62 |
| Change (%) | -46.77% | -24.88% | -9.45% | - | +1.99% | +18.91% | +30.35% |
| Change | -0.94 | -0.50 | -0.19 | - | +0.04 | +0.38 | +0.61 |
| Level | Major | Major | Major | - | Major | Major | Intermediate |
Attention could also be paid to pivot points to set price objectives:
| Pivot points | S3 | S2 | S1 | PP | R1 | R2 | R3 |
|---|---|---|---|---|---|---|---|
| Standard | 1.88 | 1.95 | 1.98 | 2.05 | 2.08 | 2.15 | 2.18 |
| Camarilla | 1.99 | 2.00 | 2.01 | 2.02 | 2.03 | 2.04 | 2.05 |
| Woodie | 1.87 | 1.94 | 1.97 | 2.04 | 2.07 | 2.14 | 2.17 |
| Fibonacci | 1.95 | 1.99 | 2.01 | 2.05 | 2.09 | 2.11 | 2.15 |
| Pivot points | S3 | S2 | S1 | PP | R1 | R2 | R3 |
|---|---|---|---|---|---|---|---|
| Standard | 1.77 | 1.88 | 1.98 | 2.09 | 2.19 | 2.30 | 2.40 |
| Camarilla | 2.02 | 2.04 | 2.06 | 2.08 | 2.10 | 2.12 | 2.14 |
| Woodie | 1.77 | 1.88 | 1.98 | 2.09 | 2.19 | 2.30 | 2.40 |
| Fibonacci | 1.88 | 1.96 | 2.01 | 2.09 | 2.17 | 2.22 | 2.30 |
| Pivot points | S3 | S2 | S1 | PP | R1 | R2 | R3 |
|---|---|---|---|---|---|---|---|
| Standard | 1.19 | 1.56 | 1.82 | 2.19 | 2.45 | 2.82 | 3.08 |
| Camarilla | 1.90 | 1.96 | 2.01 | 2.07 | 2.13 | 2.19 | 2.24 |
| Woodie | 1.13 | 1.53 | 1.76 | 2.16 | 2.39 | 2.79 | 3.02 |
| Fibonacci | 1.56 | 1.80 | 1.95 | 2.19 | 2.43 | 2.58 | 2.82 |
Numerical data
The following is the status of technical indicators and moving averages registered at the time this technical analysis was created:
| RSI (14): | 42.43 | |
| MACD (12,26,9): | -0.0400 | |
| Directional Movement: | -6.83 | |
| AROON (14): | 71.43 | |
| DEMA (21): | 2.02 | |
| Parabolic SAR (0,02-0,02-0,2): | 2.20 | |
| Elder Ray (13): | -0.08 | |
| Super Trend (3,10): | 2.27 | |
| Zig ZAG (10): | 1.99 | |
| VORTEX (21): | 0.9200 | |
| Stochastique (14,3,5): | 35.26 | |
| TEMA (21): | 2.03 | |
| Williams %R (14): | -78.85 | |
| Chande Momentum Oscillator (20): | -0.07 | |
| Repulse (5,40,3): | -2.1000 | |
| ROCnROLL: | 2 | |
| TRIX (15,9): | -0.3500 | |
| Courbe Coppock: | 1.86 |
| MA7: | 2.08 | |
| MA20: | 2.05 | |
| MA50: | 2.21 | |
| MA100: | 2.21 | |
| MAexp7: | 2.05 | |
| MAexp20: | 2.07 | |
| MAexp50: | 2.15 | |
| MAexp100: | 2.20 | |
| Price / MA7: | -3.37% | |
| Price / MA20: | -1.95% | |
| Price / MA50: | -9.05% | |
| Price / MA100: | -9.05% | |
| Price / MAexp7: | -1.95% | |
| Price / MAexp20: | -2.90% | |
| Price / MAexp50: | -6.51% | |
| Price / MAexp100: | -8.64% |
News
The last news published on TASEKO MINES LTD. at the time of the generation of this analysis was as follows:
- Taseko Mines Announces the Appointment of Crystal Smith to its Board of Directors
- Taseko Reports Third Quarter 2024 Operational Performance and $48 Million of Adjusted EBITDA
- Taseko to Release Third Quarter 2024 Results
- Taseko Mines Provides Construction Update for Florence Copper
- Taseko Mines Limited - Taseko Reports Second Quarter 2024 Results
About author
Online


Add a comment
Comments
0 comments on the analysis TASEKO MINES LTD. - Daily