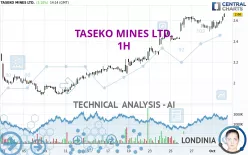
TASEKO MINES LTD. - 1H - Technical analysis published on 10/02/2024 (GMT)
- 143
- 0
Click here for a new analysis!
- Timeframe : 1H
- - Analysis generated on
- Status : INVALID

Summary of the analysis

Additional analysis
Quotes
The TASEKO MINES LTD. price is 2.66 USD. On the day, this instrument gained +3.10% with the lowest point at 2.59 USD and the highest point at 2.67 USD. The deviation from the price is +2.70% for the low point and -0.37% for the high point.A bullish opening was detected by the Central Gaps scanner. Buyers are trying to impose a bullish momentum in the very short term.
Bullish opening
Type : Bullish
Timeframe : Openning
A study of price movements over other periods shows the following variations:
New HIGH record (1 month)
Type : Bullish
Timeframe : Weekly
Technical
Technical analysis of TASEKO MINES LTD. in 1H shows a strongly overall bullish trend. 89.29% of the signals given by moving averages are bullish. The slightly bullish signals given by the short-term moving averages indicate this trend is showing signs of running out of steam. The Central Indicators market scanner currently does not detect any result that concerns moving averages.
In fact, 12 technical indicators on 18 studied are currently bullish. But beware of excesses. The Central Indicators scanner currently detects this:
CCI indicator is overbought : over 100
Type : Neutral
Timeframe : 1 hour
Williams %R indicator is overbought : over -20
Type : Neutral
Timeframe : 1 hour
Pivot points : price is over resistance 1
Type : Neutral
Timeframe : 1 hour
MACD crosses UP its Moving Average
Type : Bullish
Timeframe : 1 hour
An analysis of the price chart with the Central Patterns scanner (detector of chart patterns and resistances and supports) shows several results that can have an impact on the price change:
Near horizontal resistance
Type : Bearish
Timeframe : 1 hour
Near resistance of channel
Type : Bearish
Timeframe : 1 hour
Resistance of triangle is broken
Type : Bullish
Timeframe : 1 hour
The Central Candlesticks scanner which studies Japanese candlesticks did not detect anything.
| S3 | S2 | S1 | Price | R1 | R2 | R3 | |
|---|---|---|---|---|---|---|---|
| ProTrendLines | 2.39 | 2.49 | 2.62 | 2.66 | 3.05 | 3.51 | 4.24 |
| Change (%) | -10.15% | -6.39% | -1.50% | - | +14.66% | +31.95% | +59.40% |
| Change | -0.27 | -0.17 | -0.04 | - | +0.39 | +0.85 | +1.58 |
| Level | Major | Intermediate | Major | - | Major | Minor | Minor |
Pivot points can also be used to set your price objectives. Here is the price situation in relation to pivot points:
| Pivot points | S3 | S2 | S1 | PP | R1 | R2 | R3 |
|---|---|---|---|---|---|---|---|
| Standard | 2.45 | 2.49 | 2.53 | 2.57 | 2.61 | 2.65 | 2.69 |
| Camarilla | 2.56 | 2.57 | 2.57 | 2.58 | 2.59 | 2.60 | 2.60 |
| Woodie | 2.46 | 2.49 | 2.54 | 2.57 | 2.62 | 2.65 | 2.70 |
| Fibonacci | 2.49 | 2.52 | 2.54 | 2.57 | 2.60 | 2.62 | 2.65 |
| Pivot points | S3 | S2 | S1 | PP | R1 | R2 | R3 |
|---|---|---|---|---|---|---|---|
| Standard | 1.98 | 2.12 | 2.36 | 2.50 | 2.74 | 2.88 | 3.12 |
| Camarilla | 2.50 | 2.53 | 2.57 | 2.60 | 2.64 | 2.67 | 2.71 |
| Woodie | 2.03 | 2.15 | 2.41 | 2.53 | 2.79 | 2.91 | 3.17 |
| Fibonacci | 2.12 | 2.27 | 2.36 | 2.50 | 2.65 | 2.74 | 2.88 |
| Pivot points | S3 | S2 | S1 | PP | R1 | R2 | R3 |
|---|---|---|---|---|---|---|---|
| Standard | 1.29 | 1.59 | 2.05 | 2.35 | 2.81 | 3.11 | 3.57 |
| Camarilla | 2.31 | 2.38 | 2.45 | 2.52 | 2.59 | 2.66 | 2.73 |
| Woodie | 1.38 | 1.63 | 2.14 | 2.39 | 2.90 | 3.15 | 3.66 |
| Fibonacci | 1.59 | 1.88 | 2.06 | 2.35 | 2.64 | 2.82 | 3.11 |
Numerical data
The following is the status of the technical indicators and moving averages at the time of publication of this technical analysis:
| RSI (14): | 61.50 | |
| MACD (12,26,9): | 0.0200 | |
| Directional Movement: | 19.56 | |
| AROON (14): | 64.29 | |
| DEMA (21): | 2.60 | |
| Parabolic SAR (0,02-0,02-0,2): | 2.49 | |
| Elder Ray (13): | 0.05 | |
| Super Trend (3,10): | 2.50 | |
| Zig ZAG (10): | 2.62 | |
| VORTEX (21): | 1.0000 | |
| Stochastique (14,3,5): | 87.40 | |
| TEMA (21): | 2.58 | |
| Williams %R (14): | -3.33 | |
| Chande Momentum Oscillator (20): | 0.10 | |
| Repulse (5,40,3): | 3.0500 | |
| ROCnROLL: | 1 | |
| TRIX (15,9): | 0.1200 | |
| Courbe Coppock: | 0.10 |
| MA7: | 2.55 | |
| MA20: | 2.24 | |
| MA50: | 2.18 | |
| MA100: | 2.36 | |
| MAexp7: | 2.60 | |
| MAexp20: | 2.56 | |
| MAexp50: | 2.49 | |
| MAexp100: | 2.37 | |
| Price / MA7: | +4.31% | |
| Price / MA20: | +18.75% | |
| Price / MA50: | +22.02% | |
| Price / MA100: | +12.71% | |
| Price / MAexp7: | +2.31% | |
| Price / MAexp20: | +3.91% | |
| Price / MAexp50: | +6.83% | |
| Price / MAexp100: | +12.24% |
News
The latest news and videos published on TASEKO MINES LTD. at the time of the analysis were as follows:
- Taseko Mines Limited - Taseko Reports Second Quarter 2024 Results
- Taseko Reports Second Quarter 2024 Financial and Operational Performance and Florence Construction Update
- Taseko Mines Limited - Taseko to Release Second Quarter 2024 Results
- Taseko to Release Second Quarter 2024 Results
- Taseko Mines Limited - Taseko Reports Second Quarter Update for Gibraltar
About author
Online


Add a comment
Comments
0 comments on the analysis TASEKO MINES LTD. - 1H