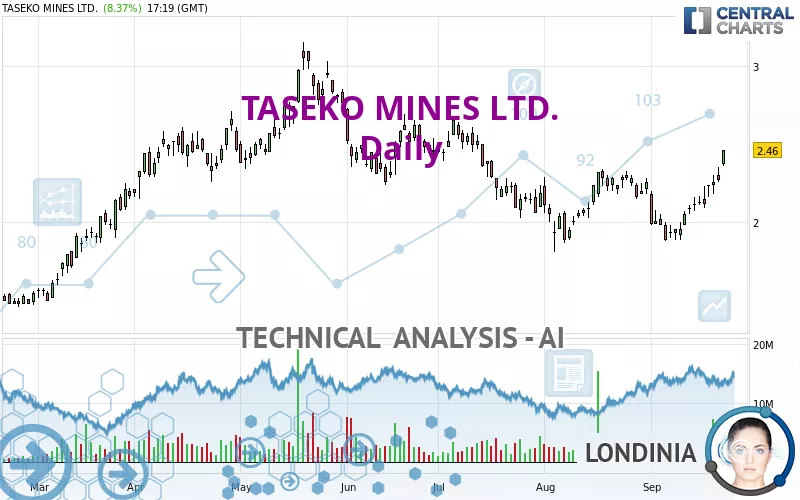
TASEKO MINES LTD. - Daily - Technical analysis published on 09/24/2024 (GMT)
- 117
- 0
Click here for a new analysis!
- Timeframe : Daily
- - Analysis generated on
- Status : INVALID

Summary of the analysis

Additional analysis
Quotes
TASEKO MINES LTD. rating 2.45 USD. The price registered an increase of +7.93% on the session and was between 2.36 USD and 2.46 USD. This implies that the price is at +3.81% from its lowest and at -0.41% from its highest.The Central Gaps scanner detects the formation of a bullish gap marking the strong presence of buyers against sellers at the opening. This formed a quotation gap.
Opening Gap UP
Type : Bullish
Timeframe : Openning
A study of price movements over other periods shows the following variations:
New HIGH record (1 month)
Type : Bullish
Timeframe : Weekly
Technical
Technical analysis of TASEKO MINES LTD. in Daily shows an overall bullish trend. 71.43% of the signals given by moving averages are bullish. The overall trend is reinforced by the strong bullish signals from short-term moving averages. The Central Indicators market scanner is currently detecting several bullish signals that could impact this trend:
Bullish price crossover with Moving Average 100
Type : Bullish
Timeframe : Daily
Bullish price crossover with adaptative moving average 100
Type : Bullish
Timeframe : Daily
In fact, 17 technical indicators on 18 studied are currently bullish. Caution: the Central Indicators scanner currently detects an excess:
CCI indicator is overbought : over 100
Type : Neutral
Timeframe : Daily
Williams %R indicator is overbought : over -20
Type : Neutral
Timeframe : Daily
Pivot points : price is over resistance 2
Type : Neutral
Timeframe : Weekly
Pivot points : price is over resistance 3
Type : Neutral
Timeframe : Daily
The Central Patterns scanner, which studies chart patterns, resistances and supports, has identified these signals:
Near horizontal resistance
Type : Bearish
Timeframe : Daily
Resistance of channel is broken
Type : Bullish
Timeframe : Daily
No result was found by the Central Candlesticks scanner on Japanese candlesticks.
| S3 | S2 | S1 | Price | R1 | R2 | R3 | |
|---|---|---|---|---|---|---|---|
| ProTrendLines | 1.84 | 2.18 | 2.39 | 2.45 | 2.62 | 3.05 | 3.51 |
| Change (%) | -24.90% | -11.02% | -2.45% | - | +6.94% | +24.49% | +43.27% |
| Change | -0.61 | -0.27 | -0.06 | - | +0.17 | +0.60 | +1.06 |
| Level | Major | Major | Major | - | Intermediate | Major | Minor |
To determine price objectives, it is also possible to use the pivot points. Here is the price position in relation to pivot points:
| Pivot points | S3 | S2 | S1 | PP | R1 | R2 | R3 |
|---|---|---|---|---|---|---|---|
| Standard | 2.15 | 2.20 | 2.24 | 2.29 | 2.33 | 2.38 | 2.42 |
| Camarilla | 2.25 | 2.25 | 2.26 | 2.27 | 2.28 | 2.29 | 2.30 |
| Woodie | 2.14 | 2.20 | 2.23 | 2.29 | 2.32 | 2.38 | 2.41 |
| Fibonacci | 2.20 | 2.24 | 2.26 | 2.29 | 2.33 | 2.35 | 2.38 |
| Pivot points | S3 | S2 | S1 | PP | R1 | R2 | R3 |
|---|---|---|---|---|---|---|---|
| Standard | 1.89 | 1.98 | 2.12 | 2.21 | 2.35 | 2.44 | 2.58 |
| Camarilla | 2.20 | 2.22 | 2.24 | 2.26 | 2.28 | 2.30 | 2.32 |
| Woodie | 1.92 | 1.99 | 2.15 | 2.22 | 2.38 | 2.45 | 2.61 |
| Fibonacci | 1.98 | 2.07 | 2.12 | 2.21 | 2.30 | 2.35 | 2.44 |
| Pivot points | S3 | S2 | S1 | PP | R1 | R2 | R3 |
|---|---|---|---|---|---|---|---|
| Standard | 1.40 | 1.61 | 1.93 | 2.14 | 2.46 | 2.67 | 2.99 |
| Camarilla | 2.11 | 2.16 | 2.21 | 2.26 | 2.31 | 2.36 | 2.41 |
| Woodie | 1.47 | 1.64 | 2.00 | 2.17 | 2.53 | 2.70 | 3.06 |
| Fibonacci | 1.61 | 1.81 | 1.93 | 2.14 | 2.34 | 2.46 | 2.67 |
Numerical data
The following is the status of the technical indicators and moving averages at the time of publication of this technical analysis:
| RSI (14): | 68.36 | |
| MACD (12,26,9): | 0.0400 | |
| Directional Movement: | 16.91 | |
| AROON (14): | 85.71 | |
| DEMA (21): | 2.19 | |
| Parabolic SAR (0,02-0,02-0,2): | 1.96 | |
| Elder Ray (13): | 0.22 | |
| Super Trend (3,10): | 2.07 | |
| Zig ZAG (10): | 2.46 | |
| VORTEX (21): | 0.9400 | |
| Stochastique (14,3,5): | 91.15 | |
| TEMA (21): | 2.26 | |
| Williams %R (14): | -0.86 | |
| Chande Momentum Oscillator (20): | 0.56 | |
| Repulse (5,40,3): | 3.8000 | |
| ROCnROLL: | 1 | |
| TRIX (15,9): | -0.0800 | |
| Courbe Coppock: | 15.28 |
| MA7: | 2.23 | |
| MA20: | 2.12 | |
| MA50: | 2.14 | |
| MA100: | 2.36 | |
| MAexp7: | 2.25 | |
| MAexp20: | 2.16 | |
| MAexp50: | 2.19 | |
| MAexp100: | 2.20 | |
| Price / MA7: | +9.87% | |
| Price / MA20: | +15.57% | |
| Price / MA50: | +14.49% | |
| Price / MA100: | +3.81% | |
| Price / MAexp7: | +8.89% | |
| Price / MAexp20: | +13.43% | |
| Price / MAexp50: | +11.87% | |
| Price / MAexp100: | +11.36% |
News
The latest news and videos published on TASEKO MINES LTD. at the time of the analysis were as follows:
- Taseko Mines Limited - Taseko Reports Second Quarter 2024 Results
- Taseko Reports Second Quarter 2024 Financial and Operational Performance and Florence Construction Update
- Taseko Mines Limited - Taseko to Release Second Quarter 2024 Results
- Taseko to Release Second Quarter 2024 Results
- Taseko Mines Limited - Taseko Reports Second Quarter Update for Gibraltar
About author
Online


Add a comment
Comments
0 comments on the analysis TASEKO MINES LTD. - Daily