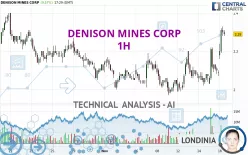
DENISON MINES CORP - 1H - Technical analysis published on 11/18/2024 (GMT)
- 131
- 0
Click here for a new analysis!
- Timeframe : 1H
- - Analysis generated on
- Status : TARGET REACHED

Summary of the analysis

Additional analysis
Quotes
The DENISON MINES CORP price is 2.29 USD. The price registered an increase of +9.57% on the session with the lowest point at 2.16 USD and the highest point at 2.33 USD. The deviation from the price is +6.02% for the low point and -1.72% for the high point.The Central Gaps scanner detects a bullish opening. A small advantage for buyers in the very short term.
Bullish opening
Type : Bullish
Timeframe : Openning
A study of price movements over other periods shows the following variations:
Near a new HIGH record (1 month)
Type : Bullish
Timeframe : Weekly
Technical
A technical analysis in 1H of this DENISON MINES CORP chart shows a strongly bullish trend. 89.29% of the signals given by moving averages are bullish. The overall trend is supported by the strong bullish signals from short-term moving averages. There is no crossing of moving average by the price or crossing of moving averages between themselves.
In fact, according to the parameters integrated into the Central Analyzer system, 16 technical indicators out of 18 analysed are currently bullish. Caution: the Central Indicators scanner currently detects an excess:
CCI indicator is overbought : over 100
Type : Neutral
Timeframe : 1 hour
Previous candle closed over Bollinger bands
Type : Neutral
Timeframe : 1 hour
Williams %R indicator is overbought : over -20
Type : Neutral
Timeframe : 1 hour
Pivot points : price is over resistance 1
Type : Neutral
Timeframe : 1 hour
Pivot points : price is over resistance 1
Type : Neutral
Timeframe : Weekly
An analysis of the price chart with the Central Patterns scanner (detector of chart patterns and resistances and supports) shows several results that can have an impact on the price change:
Near horizontal resistance
Type : Bearish
Timeframe : 1 hour
Resistance of channel is broken
Type : Bullish
Timeframe : 1 hour
The Central Candlesticks scanner, specialised in Japanese candlesticks, did not identify any signals.
| S3 | S2 | S1 | Price | R1 | R2 | |
|---|---|---|---|---|---|---|
| ProTrendLines | 2.12 | 2.20 | 2.28 | 2.29 | 2.42 | 4.45 |
| Change (%) | -7.42% | -3.93% | -0.44% | - | +5.68% | +94.32% |
| Change | -0.17 | -0.09 | -0.01 | - | +0.13 | +2.16 |
| Level | Major | Intermediate | Major | - | Major | Intermediate |
To determine price objectives, it is also possible to use the pivot points. Here is the price position in relation to pivot points:
| Pivot points | S3 | S2 | S1 | PP | R1 | R2 | R3 |
|---|---|---|---|---|---|---|---|
| Standard | 1.82 | 1.92 | 2.01 | 2.11 | 2.20 | 2.30 | 2.39 |
| Camarilla | 2.04 | 2.06 | 2.07 | 2.09 | 2.11 | 2.13 | 2.14 |
| Woodie | 1.81 | 1.92 | 2.00 | 2.11 | 2.19 | 2.30 | 2.38 |
| Fibonacci | 1.92 | 2.00 | 2.04 | 2.11 | 2.19 | 2.23 | 2.30 |
| Pivot points | S3 | S2 | S1 | PP | R1 | R2 | R3 |
|---|---|---|---|---|---|---|---|
| Standard | 1.72 | 1.84 | 1.97 | 2.09 | 2.22 | 2.34 | 2.47 |
| Camarilla | 2.02 | 2.04 | 2.07 | 2.09 | 2.11 | 2.14 | 2.16 |
| Woodie | 1.72 | 1.84 | 1.97 | 2.09 | 2.22 | 2.34 | 2.47 |
| Fibonacci | 1.84 | 1.94 | 2.00 | 2.09 | 2.19 | 2.25 | 2.34 |
| Pivot points | S3 | S2 | S1 | PP | R1 | R2 | R3 |
|---|---|---|---|---|---|---|---|
| Standard | 1.23 | 1.53 | 1.81 | 2.11 | 2.39 | 2.69 | 2.97 |
| Camarilla | 1.94 | 1.99 | 2.05 | 2.10 | 2.15 | 2.21 | 2.26 |
| Woodie | 1.23 | 1.53 | 1.81 | 2.11 | 2.39 | 2.69 | 2.97 |
| Fibonacci | 1.53 | 1.75 | 1.89 | 2.11 | 2.33 | 2.47 | 2.69 |
Numerical data
The following are the details of the technical indicators and moving averages that were collected to generate this technical analysis:
| RSI (14): | 66.07 | |
| MACD (12,26,9): | 0.0500 | |
| Directional Movement: | 28.33 | |
| AROON (14): | 92.86 | |
| DEMA (21): | 2.21 | |
| Parabolic SAR (0,02-0,02-0,2): | 2.09 | |
| Elder Ray (13): | 0.12 | |
| Super Trend (3,10): | 2.11 | |
| Zig ZAG (10): | 2.28 | |
| VORTEX (21): | 1.1300 | |
| Stochastique (14,3,5): | 90.37 | |
| TEMA (21): | 2.25 | |
| Williams %R (14): | -16.67 | |
| Chande Momentum Oscillator (20): | 0.21 | |
| Repulse (5,40,3): | 1.4300 | |
| ROCnROLL: | 1 | |
| TRIX (15,9): | 0.1800 | |
| Courbe Coppock: | 14.30 |
| MA7: | 2.11 | |
| MA20: | 2.13 | |
| MA50: | 1.96 | |
| MA100: | 1.87 | |
| MAexp7: | 2.23 | |
| MAexp20: | 2.15 | |
| MAexp50: | 2.11 | |
| MAexp100: | 2.10 | |
| Price / MA7: | +8.53% | |
| Price / MA20: | +7.51% | |
| Price / MA50: | +16.84% | |
| Price / MA100: | +22.46% | |
| Price / MAexp7: | +2.69% | |
| Price / MAexp20: | +6.51% | |
| Price / MAexp50: | +8.53% | |
| Price / MAexp100: | +9.05% |
News
Don't forget to follow the news on DENISON MINES CORP. At the time of publication of this analysis, the latest news was as follows:
- Denison to File Early Warning Report in Respect of Foremost Clean Energy Ltd.
- Denison Reports Financial and Operational Results for Q3'2024, Including Positive Progress on Phoenix Engineering and Regulatory Review
- Foremost Clean Energy Announces Brokered Private Placement for Gross Proceeds of up to C$7.0 Million, Including Participation of Denison Mines
- Foremost Clean Energy Completes First Phase of Option Agreement with Denison Mines for Interest in 10 Uranium Properties in the Athabasca Basin
- Denison Files Early Warning Report in Respect of Foremost Clean Energy Ltd.
About author
Online


Add a comment
Comments
0 comments on the analysis DENISON MINES CORP - 1H