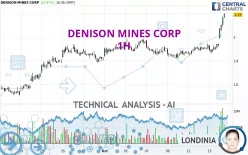
DENISON MINES CORP - 1H - Technical analysis published on 10/16/2024 (GMT)
- 122
- 0
Click here for a new analysis!
- Timeframe : 1H
- - Analysis generated on
- Status : TARGET REACHED

Summary of the analysis

Additional analysis
Quotes
The DENISON MINES CORP price is 2.19 USD. The price registered an increase of +13.47% on the session and was traded between 1.98 USD and 2.20 USD over the period. The price is currently at +10.61% from its lowest and -0.45% from its highest.A bullish gap was detected at the opening by the Central Gaps scanner. There are a lot of buyers and they have the upper hand in the very short term.
Opening Gap UP
Type : Bullish
Timeframe : Openning
A study of price movements over other periods shows the following variations:
New HIGH record (1 month)
Type : Bullish
Timeframe : Weekly
Technical
Technical analysis of DENISON MINES CORP in 1H shows a strongly overall bullish trend. 92.86% of the signals given by moving averages are bullish. The overall trend is supported by the strong bullish signals from short-term moving averages. The Central Indicators market scanner currently does not detect any result that concerns moving averages.
In fact, according to the parameters integrated into the Central Analyzer system, 16 technical indicators out of 18 analysed are currently bullish. Caution: the Central Indicators scanner currently detects an excess:
RSI indicator is overbought : over 80
Type : Neutral
Timeframe : 1 hour
CCI indicator is overbought : over 100
Type : Neutral
Timeframe : 1 hour
Previous candle closed over Bollinger bands
Type : Neutral
Timeframe : 1 hour
Williams %R indicator is overbought : over -20
Type : Neutral
Timeframe : 1 hour
Pivot points : price is over resistance 3
Type : Neutral
Timeframe : 1 hour
Pivot points : price is over resistance 3
Type : Neutral
Timeframe : Weekly
Central Patterns, the market scanner focusing on chart patterns, resistances and supports found these results:
Near horizontal resistance
Type : Bearish
Timeframe : 1 hour
Resistance of channel is broken
Type : Bullish
Timeframe : 1 hour
No result was found by the Central Candlesticks scanner on Japanese candlesticks.
| S3 | S2 | S1 | Price | R1 | R2 | R3 | |
|---|---|---|---|---|---|---|---|
| ProTrendLines | 1.92 | 1.97 | 2.12 | 2.19 | 2.28 | 2.42 | 4.45 |
| Change (%) | -12.33% | -10.05% | -3.20% | - | +4.11% | +10.50% | +103.20% |
| Change | -0.27 | -0.22 | -0.07 | - | +0.09 | +0.23 | +2.26 |
| Level | Minor | Major | Major | - | Intermediate | Major | Intermediate |
To determine price objectives, it is also possible to use the pivot points. Here is the price position in relation to pivot points:
| Pivot points | S3 | S2 | S1 | PP | R1 | R2 | R3 |
|---|---|---|---|---|---|---|---|
| Standard | 1.80 | 1.83 | 1.88 | 1.91 | 1.96 | 1.99 | 2.04 |
| Camarilla | 1.91 | 1.92 | 1.92 | 1.93 | 1.94 | 1.95 | 1.95 |
| Woodie | 1.81 | 1.84 | 1.89 | 1.92 | 1.97 | 2.00 | 2.05 |
| Fibonacci | 1.83 | 1.86 | 1.88 | 1.91 | 1.94 | 1.96 | 1.99 |
| Pivot points | S3 | S2 | S1 | PP | R1 | R2 | R3 |
|---|---|---|---|---|---|---|---|
| Standard | 1.69 | 1.75 | 1.84 | 1.90 | 1.99 | 2.05 | 2.14 |
| Camarilla | 1.88 | 1.89 | 1.91 | 1.92 | 1.93 | 1.95 | 1.96 |
| Woodie | 1.70 | 1.76 | 1.85 | 1.91 | 2.00 | 2.06 | 2.15 |
| Fibonacci | 1.75 | 1.81 | 1.85 | 1.90 | 1.96 | 2.00 | 2.05 |
| Pivot points | S3 | S2 | S1 | PP | R1 | R2 | R3 |
|---|---|---|---|---|---|---|---|
| Standard | 0.97 | 1.18 | 1.51 | 1.72 | 2.05 | 2.26 | 2.59 |
| Camarilla | 1.68 | 1.73 | 1.78 | 1.83 | 1.88 | 1.93 | 1.98 |
| Woodie | 1.02 | 1.21 | 1.56 | 1.75 | 2.10 | 2.29 | 2.64 |
| Fibonacci | 1.18 | 1.39 | 1.52 | 1.72 | 1.93 | 2.06 | 2.26 |
Numerical data
The following is the status of the technical indicators and moving averages at the time of publication of this technical analysis:
| RSI (14): | 81.10 | |
| MACD (12,26,9): | 0.0500 | |
| Directional Movement: | 41.92 | |
| AROON (14): | 57.14 | |
| DEMA (21): | 2.01 | |
| Parabolic SAR (0,02-0,02-0,2): | 1.89 | |
| Elder Ray (13): | 0.15 | |
| Super Trend (3,10): | 1.98 | |
| Zig ZAG (10): | 2.16 | |
| VORTEX (21): | 1.2300 | |
| Stochastique (14,3,5): | 97.92 | |
| TEMA (21): | 2.05 | |
| Williams %R (14): | -4.84 | |
| Chande Momentum Oscillator (20): | 0.26 | |
| Repulse (5,40,3): | 7.9900 | |
| ROCnROLL: | 1 | |
| TRIX (15,9): | 0.1600 | |
| Courbe Coppock: | 11.84 |
| MA7: | 1.94 | |
| MA20: | 1.87 | |
| MA50: | 1.69 | |
| MA100: | 1.87 | |
| MAexp7: | 2.03 | |
| MAexp20: | 1.96 | |
| MAexp50: | 1.91 | |
| MAexp100: | 1.87 | |
| Price / MA7: | +12.89% | |
| Price / MA20: | +17.11% | |
| Price / MA50: | +29.59% | |
| Price / MA100: | +17.11% | |
| Price / MAexp7: | +7.88% | |
| Price / MAexp20: | +11.73% | |
| Price / MAexp50: | +14.66% | |
| Price / MAexp100: | +17.11% |
News
The latest news and videos published on DENISON MINES CORP at the time of the analysis were as follows:
- Foremost Clean Energy Completes First Phase of Option Agreement with Denison Mines for Interest in 10 Uranium Properties in the Athabasca Basin
- Denison Files Early Warning Report in Respect of Foremost Clean Energy Ltd.
- Denison Announces Option of Non-Core Exploration Projects to Foremost for up to $30 Million in Combined Consideration
- Grounded Lithium Announces Robust $4.5 Million Budget Funded by Denison Mines for the Kindersley Lithium Project
- Denison CEO Highlights Phoenix Post-Feasibility Study Progress and Company Reports Financial and Operational Results for Q2'2024
About author
Online


Add a comment
Comments
0 comments on the analysis DENISON MINES CORP - 1H