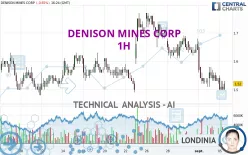
DENISON MINES CORP - 1H - Technical analysis published on 09/05/2024 (GMT)
- 147
- 0
Click here for a new analysis!
- Timeframe : 1H
- - Analysis generated on
- Status : TARGET REACHED

Summary of the analysis

Additional analysis
Quotes
The DENISON MINES CORP price is 1.52 USD. The price is lower by -0.65% since the last closing and was between 1.50 USD and 1.55 USD. This implies that the price is at +1.33% from its lowest and at -1.94% from its highest.A bullish opening was detected by the Central Gaps scanner. Buyers are trying to impose a bullish momentum in the very short term.
Bullish opening
Type : Bullish
Timeframe : Openning
A study of price movements over other periods shows the following variations:
Technical
Technical analysis of this 1H chart of DENISON MINES CORP indicates that the overall trend is strongly bearish. The signals given by moving averages are 89.29% bearish. This strong bearish trend is confirmed by the strong signals currently being given by short-term moving averages. The Central Indicators scanner does not detect any result on moving averages that would impact this trend.
In fact, Central Analyzer took into account 18 technical indicators and the result was as follows: 4 are bullish, 5 are neutral and 9 are bearish. But beware of excesses. The Central Indicators scanner currently detects this:
MACD indicator: bullish divergence
Type : Bullish
Timeframe : 1 hour
Williams %R indicator is oversold : under -80
Type : Neutral
Timeframe : 1 hour
Pivot points : price is under support 3
Type : Neutral
Timeframe : Weekly
Central Patterns, the market scanner focusing on chart patterns, resistances and supports found these results:
Near horizontal support
Type : Bullish
Timeframe : 1 hour
Support of channel is broken
Type : Bearish
Timeframe : 1 hour
Central Candlesticks, the scanner specialised in Japanese candlesticks, detects this inversion signal that could impact the current short-term trend:
Doji
Type : Neutral
Timeframe : 1 hour
| S3 | S2 | S1 | Price | R1 | R2 | R3 | |
|---|---|---|---|---|---|---|---|
| ProTrendLines | 1.29 | 1.42 | 1.50 | 1.52 | 1.63 | 1.79 | 1.88 |
| Change (%) | -15.13% | -6.58% | -1.32% | - | +7.24% | +17.76% | +23.68% |
| Change | -0.23 | -0.10 | -0.02 | - | +0.11 | +0.27 | +0.36 |
| Level | Minor | Minor | Major | - | Major | Major | Minor |
To determine price objectives, it is also possible to use the pivot points. Here is the price position in relation to pivot points:
| Pivot points | S3 | S2 | S1 | PP | R1 | R2 | R3 |
|---|---|---|---|---|---|---|---|
| Standard | 1.43 | 1.47 | 1.50 | 1.54 | 1.57 | 1.61 | 1.64 |
| Camarilla | 1.51 | 1.52 | 1.52 | 1.53 | 1.54 | 1.54 | 1.55 |
| Woodie | 1.43 | 1.47 | 1.50 | 1.54 | 1.57 | 1.61 | 1.64 |
| Fibonacci | 1.47 | 1.50 | 1.51 | 1.54 | 1.57 | 1.58 | 1.61 |
| Pivot points | S3 | S2 | S1 | PP | R1 | R2 | R3 |
|---|---|---|---|---|---|---|---|
| Standard | 1.44 | 1.52 | 1.60 | 1.68 | 1.76 | 1.84 | 1.92 |
| Camarilla | 1.63 | 1.64 | 1.66 | 1.67 | 1.69 | 1.70 | 1.71 |
| Woodie | 1.43 | 1.52 | 1.59 | 1.68 | 1.75 | 1.84 | 1.91 |
| Fibonacci | 1.52 | 1.58 | 1.62 | 1.68 | 1.74 | 1.78 | 1.84 |
| Pivot points | S3 | S2 | S1 | PP | R1 | R2 | R3 |
|---|---|---|---|---|---|---|---|
| Standard | 0.87 | 1.14 | 1.41 | 1.68 | 1.95 | 2.22 | 2.49 |
| Camarilla | 1.52 | 1.57 | 1.62 | 1.67 | 1.72 | 1.77 | 1.82 |
| Woodie | 0.86 | 1.14 | 1.40 | 1.68 | 1.94 | 2.22 | 2.48 |
| Fibonacci | 1.14 | 1.35 | 1.48 | 1.68 | 1.89 | 2.02 | 2.22 |
Numerical data
The following is the status of the technical indicators and moving averages at the time of publication of this technical analysis:
| RSI (14): | 35.94 | |
| MACD (12,26,9): | -0.0300 | |
| Directional Movement: | -10.61 | |
| AROON (14): | -50.00 | |
| DEMA (21): | 1.51 | |
| Parabolic SAR (0,02-0,02-0,2): | 1.56 | |
| Elder Ray (13): | -0.02 | |
| Super Trend (3,10): | 1.61 | |
| Zig ZAG (10): | 1.51 | |
| VORTEX (21): | 0.8400 | |
| Stochastique (14,3,5): | 14.58 | |
| TEMA (21): | 1.50 | |
| Williams %R (14): | -81.25 | |
| Chande Momentum Oscillator (20): | -0.01 | |
| Repulse (5,40,3): | -0.9400 | |
| ROCnROLL: | 2 | |
| TRIX (15,9): | -0.2800 | |
| Courbe Coppock: | 5.59 |
| MA7: | 1.60 | |
| MA20: | 1.58 | |
| MA50: | 1.81 | |
| MA100: | 1.97 | |
| MAexp7: | 1.52 | |
| MAexp20: | 1.55 | |
| MAexp50: | 1.59 | |
| MAexp100: | 1.61 | |
| Price / MA7: | -5.00% | |
| Price / MA20: | -3.80% | |
| Price / MA50: | -16.02% | |
| Price / MA100: | -22.84% | |
| Price / MAexp7: | -0% | |
| Price / MAexp20: | -1.94% | |
| Price / MAexp50: | -4.40% | |
| Price / MAexp100: | -5.59% |
News
Don't forget to follow the news on DENISON MINES CORP. At the time of publication of this analysis, the latest news was as follows:
- Denison CEO Highlights Phoenix Post-Feasibility Study Progress and Company Reports Financial and Operational Results for Q2'2024
- Denison Announces Signing of Wheeler River Benefit Agreements with Kineepik Métis Local #9 and the Village of Pinehouse Lake
- Denison Announces Completion of Inaugural ISR Field Test Program at Midwest
- Denison Announces Results of Shareholder Meeting & Appointment of Jennifer Traub as Board Chair
- Denison Reports Financial and Operational Results for Q1 2024
About author
Online


Add a comment
Comments
0 comments on the analysis DENISON MINES CORP - 1H