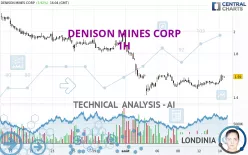
DENISON MINES CORP - 1H - Technical analysis published on 08/14/2024 (GMT)
- 115
- 0
Click here for a new analysis!
- Timeframe : 1H
- - Analysis generated on
- Status : LEVEL MAINTAINED

Summary of the analysis

Additional analysis
Quotes
The DENISON MINES CORP rating is 1.59 USD. The price has increased by +3.92% since the last closing with the lowest point at 1.53 USD and the highest point at 1.61 USD. The deviation from the price is +3.92% for the low point and -1.24% for the high point.The Central Gaps scanner detects a bullish opening. A small advantage for buyers in the very short term.
Bullish opening
Type : Bullish
Timeframe : Openning
So that you have an overall view of the price change, here is a table showing the variations over several periods:
Technical
Technical analysis of DENISON MINES CORP in 1H shows a neutral overall trend. This indecision could turn into a bullish trend due to the strong bullish signals currently being given by short-term moving averages. The Central Indicators scanner detects bullish signals on moving averages that could impact this trend:
Bullish trend reversal : Moving Average 50
Type : Bullish
Timeframe : 1 hour
Bullish trend reversal : adaptative moving average 50
Type : Bullish
Timeframe : 1 hour
Moving Average bullish crossovers : AMA20 & AMA50
Type : Bullish
Timeframe : 1 hour
The probability of a further increase is high given the direction of the technical indicators.
Caution: the Central Indicators scanner currently detects an excess:
CCI indicator is overbought : over 100
Type : Neutral
Timeframe : 1 hour
Previous candle closed over Bollinger bands
Type : Neutral
Timeframe : 1 hour
Pivot points : price is over resistance 2
Type : Neutral
Timeframe : 1 hour
Price is back over the pivot point
Type : Bullish
Timeframe : Weekly
The Central Patterns scanner, which studies chart patterns, resistances and supports, has identified these signals:
Near horizontal resistance
Type : Bearish
Timeframe : 1 hour
Resistance of channel is broken
Type : Bullish
Timeframe : 1 hour
Central Candlesticks, the scanner specialised in Japanese candlesticks, detects a bearish signal that could support the hypothesis of a small drop in the very short term:
Bearish harami
Type : Bearish
Timeframe : 1 hour
| S3 | S2 | S1 | Price | R1 | R2 | R3 | |
|---|---|---|---|---|---|---|---|
| ProTrendLines | 0.64 | 0.95 | 1.50 | 1.59 | 1.66 | 1.79 | 1.97 |
| Change (%) | -59.75% | -40.25% | -5.66% | - | +4.40% | +12.58% | +23.90% |
| Change | -0.95 | -0.64 | -0.09 | - | +0.07 | +0.20 | +0.38 |
| Level | Minor | Major | Major | - | Minor | Minor | Major |
Pivot points can also be used to set your price objectives. Here is the price situation in relation to pivot points:
| Pivot points | S3 | S2 | S1 | PP | R1 | R2 | R3 |
|---|---|---|---|---|---|---|---|
| Standard | 1.47 | 1.49 | 1.51 | 1.53 | 1.55 | 1.57 | 1.59 |
| Camarilla | 1.52 | 1.52 | 1.53 | 1.53 | 1.53 | 1.54 | 1.54 |
| Woodie | 1.47 | 1.49 | 1.51 | 1.53 | 1.55 | 1.57 | 1.59 |
| Fibonacci | 1.49 | 1.51 | 1.52 | 1.53 | 1.55 | 1.56 | 1.57 |
| Pivot points | S3 | S2 | S1 | PP | R1 | R2 | R3 |
|---|---|---|---|---|---|---|---|
| Standard | 1.18 | 1.30 | 1.39 | 1.51 | 1.60 | 1.72 | 1.81 |
| Camarilla | 1.42 | 1.44 | 1.46 | 1.48 | 1.50 | 1.52 | 1.54 |
| Woodie | 1.17 | 1.29 | 1.38 | 1.50 | 1.59 | 1.71 | 1.80 |
| Fibonacci | 1.30 | 1.38 | 1.43 | 1.51 | 1.59 | 1.64 | 1.72 |
| Pivot points | S3 | S2 | S1 | PP | R1 | R2 | R3 |
|---|---|---|---|---|---|---|---|
| Standard | 1.26 | 1.54 | 1.75 | 2.03 | 2.24 | 2.52 | 2.73 |
| Camarilla | 1.84 | 1.88 | 1.93 | 1.97 | 2.02 | 2.06 | 2.11 |
| Woodie | 1.24 | 1.52 | 1.73 | 2.01 | 2.22 | 2.50 | 2.71 |
| Fibonacci | 1.54 | 1.72 | 1.84 | 2.03 | 2.21 | 2.33 | 2.52 |
Numerical data
The following are the details of the technical indicators and moving averages that were collected to generate this technical analysis:
| RSI (14): | 62.22 | |
| MACD (12,26,9): | 0.0000 | |
| Directional Movement: | 10.62 | |
| AROON (14): | 92.86 | |
| DEMA (21): | 1.55 | |
| Parabolic SAR (0,02-0,02-0,2): | 1.50 | |
| Elder Ray (13): | 0.03 | |
| Super Trend (3,10): | 1.60 | |
| Zig ZAG (10): | 1.59 | |
| VORTEX (21): | 1.0500 | |
| Stochastique (14,3,5): | 77.65 | |
| TEMA (21): | 1.57 | |
| Williams %R (14): | -25.00 | |
| Chande Momentum Oscillator (20): | 0.06 | |
| Repulse (5,40,3): | 2.5600 | |
| ROCnROLL: | -1 | |
| TRIX (15,9): | -0.0200 | |
| Courbe Coppock: | 5.04 |
| MA7: | 1.54 | |
| MA20: | 1.74 | |
| MA50: | 1.96 | |
| MA100: | 2.04 | |
| MAexp7: | 1.57 | |
| MAexp20: | 1.54 | |
| MAexp50: | 1.57 | |
| MAexp100: | 1.66 | |
| Price / MA7: | +3.25% | |
| Price / MA20: | -8.62% | |
| Price / MA50: | -18.88% | |
| Price / MA100: | -22.06% | |
| Price / MAexp7: | +1.27% | |
| Price / MAexp20: | +3.25% | |
| Price / MAexp50: | +1.27% | |
| Price / MAexp100: | -4.22% |
News
The latest news and videos published on DENISON MINES CORP at the time of the analysis were as follows:
- Denison CEO Highlights Phoenix Post-Feasibility Study Progress and Company Reports Financial and Operational Results for Q2'2024
- Denison Announces Signing of Wheeler River Benefit Agreements with Kineepik Métis Local #9 and the Village of Pinehouse Lake
- Denison Announces Completion of Inaugural ISR Field Test Program at Midwest
- Denison Announces Results of Shareholder Meeting & Appointment of Jennifer Traub as Board Chair
- Denison Reports Financial and Operational Results for Q1 2024
About author
Online


Add a comment
Comments
0 comments on the analysis DENISON MINES CORP - 1H