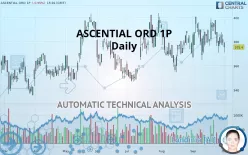
ASCENTIAL ORD 1.7P - Daily - Technical analysis published on 10/01/2019 (GMT)
- 310
- 0
Click here for a new analysis!
- Timeframe : Daily
- - Analysis generated on
- Status : TARGET REACHED

Summary of the analysis
Additional analysis
Quotes
The ASCENTIAL ORD 1P rating is 375.4 GBX. The price registered a decrease of -0.95% on the session and was traded between 371.0 GBX and 379.6 GBX over the period. The price is currently at +1.19% from its lowest and -1.11% from its highest.Here is a more detailed summary of the historical variations registered by ASCENTIAL ORD 1P:
Near a new LOW record (1 month)
Type : Bearish
Timeframe : Weekly
Technical
Technical analysis of this Daily chart of ASCENTIAL ORD 1P indicates that the overall trend is not clearly defined. The strong bearish signals currently being given by short-term moving averages could allow the overall trend to return to a bearish trend. The Central Indicators market scanner is currently detecting a bearish signal that could impact this trend:
Bearish trend reversal : Moving Average 20
Type : Bearish
Timeframe : Daily
An assessment of technical indicators shows a slightly bearish signal.
Central Indicators, the scanner specialised in technical indicators, has identified these signals:
Price is back under the pivot point
Type : Bearish
Timeframe : Daily
Price is back under the pivot point
Type : Bearish
Timeframe : Weekly
Momentum indicator is back over 0
Type : Bullish
Timeframe : Daily
Central Patterns, the market scanner focusing on chart patterns, resistances and supports found these results:
Near horizontal resistance
Type : Bearish
Timeframe : Daily
Near support of channel
Type : Bullish
Timeframe : Daily
No result was found by the Central Candlesticks scanner on Japanese candlesticks.
| S3 | S2 | S1 | Price | R1 | R2 | R3 | |
|---|---|---|---|---|---|---|---|
| ProTrendLines | 348.2 | 356.5 | 369.0 | 375.4 | 381.8 | 398.8 | 411.0 |
| Change (%) | -7.25% | -5.03% | -1.70% | - | +1.70% | +6.23% | +9.48% |
| Change | -27.2 | -18.9 | -6.4 | - | +6.4 | +23.4 | +35.6 |
| Level | Major | Minor | Major | - | Intermediate | Major | Minor |
Pivot points can also be used to set your price objectives. Here is the price situation in relation to pivot points:
| Pivot points | S3 | S2 | S1 | PP | R1 | R2 | R3 |
|---|---|---|---|---|---|---|---|
| Standard | 365.8 | 371.4 | 375.2 | 380.8 | 384.6 | 390.2 | 394.0 |
| Camarilla | 376.4 | 377.3 | 378.1 | 379.0 | 379.9 | 380.7 | 381.6 |
| Woodie | 364.9 | 371.0 | 374.3 | 380.4 | 383.7 | 389.8 | 393.1 |
| Fibonacci | 371.4 | 375.0 | 377.2 | 380.8 | 384.4 | 386.6 | 390.2 |
| Pivot points | S3 | S2 | S1 | PP | R1 | R2 | R3 |
|---|---|---|---|---|---|---|---|
| Standard | 340.0 | 355.4 | 367.2 | 382.6 | 394.4 | 409.8 | 421.6 |
| Camarilla | 371.5 | 374.0 | 376.5 | 379.0 | 381.5 | 384.0 | 386.5 |
| Woodie | 338.2 | 354.5 | 365.4 | 381.7 | 392.6 | 408.9 | 419.8 |
| Fibonacci | 355.4 | 365.8 | 372.2 | 382.6 | 393.0 | 399.4 | 409.8 |
| Pivot points | S3 | S2 | S1 | PP | R1 | R2 | R3 |
|---|---|---|---|---|---|---|---|
| Standard | 326.2 | 345.4 | 362.2 | 381.4 | 398.2 | 417.4 | 434.2 |
| Camarilla | 369.1 | 372.4 | 375.7 | 379.0 | 382.3 | 385.6 | 388.9 |
| Woodie | 325.0 | 344.8 | 361.0 | 380.8 | 397.0 | 416.8 | 433.0 |
| Fibonacci | 345.4 | 359.2 | 367.7 | 381.4 | 395.2 | 403.7 | 417.4 |
Numerical data
The following is the status of technical indicators and moving averages registered at the time this technical analysis was created:
| RSI (14): | 45.90 | |
| MACD (12,26,9): | -0.1000 | |
| Directional Movement: | -2.0 | |
| AROON (14): | 35.7 | |
| DEMA (21): | 382.0 | |
| Parabolic SAR (0,02-0,02-0,2): | 370.4 | |
| Elder Ray (13): | -5.8 | |
| Super Trend (3,10): | 361.1 | |
| Zig ZAG (10): | 375.6 | |
| VORTEX (21): | 1.0000 | |
| Stochastique (14,3,5): | 29.30 | |
| TEMA (21): | 379.8 | |
| Williams %R (14): | -83.20 | |
| Chande Momentum Oscillator (20): | -10.8 | |
| Repulse (5,40,3): | -3.7000 | |
| ROCnROLL: | 2 | |
| TRIX (15,9): | 0.1000 | |
| Courbe Coppock: | 1.40 |
| MA7: | 379.1 | |
| MA20: | 383.5 | |
| MA50: | 379.6 | |
| MA100: | 374.5 | |
| MAexp7: | 379.4 | |
| MAexp20: | 381.3 | |
| MAexp50: | 378.6 | |
| MAexp100: | 374.8 | |
| Price / MA7: | -0.98% | |
| Price / MA20: | -2.11% | |
| Price / MA50: | -1.11% | |
| Price / MA100: | +0.24% | |
| Price / MAexp7: | -1.05% | |
| Price / MAexp20: | -1.55% | |
| Price / MAexp50: | -0.85% | |
| Price / MAexp100: | +0.16% |
News
Don"t forget to follow the news on ASCENTIAL ORD 1P. At the time of publication of this analysis, the latest news was as follows:
- Edge by Ascential enters strategic partnership with Jumpshot to extend its Digital Shelf and Market Share products
- Jumpshot Strikes Strategic Partnership Deal with Ascential to Provide Marketers with Deeper Visibility into the Entire Online Customer Journey
- New Survey from Money20/20 Examines Gender Diversity and Inclusivity in Finance in the Asia-Pacific Region
- Money20/20 Asia's featured speakers share 2019 FinTech Forecast
- Edge by Ascential™ Launches to Deliver Industry-Leading Ecommerce-Driven Data, Insights and Advisory Services for Brands and Retailers
About author

Online


Add a comment
Comments
0 comments on the analysis ASCENTIAL ORD 1.7P - Daily