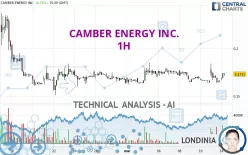
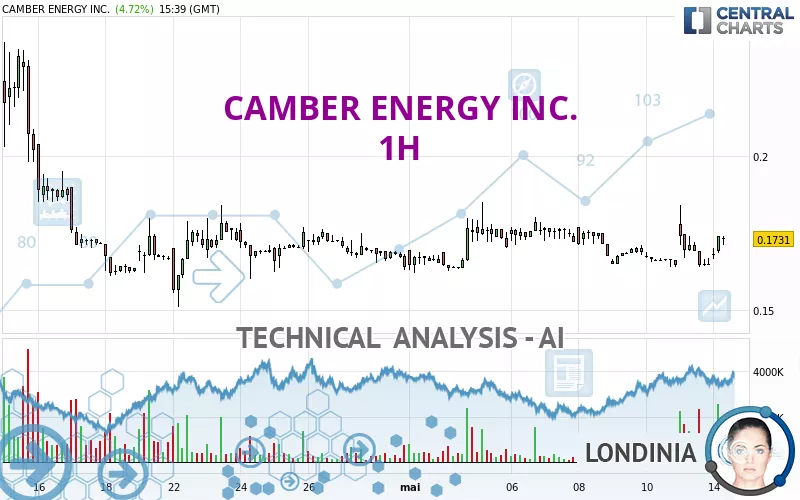
CAMBER ENERGY INC. - 1H - Technical analysis published on 05/14/2024 (GMT)
- 106
- 0
Click here for a new analysis!
- Timeframe : 1H
- - Analysis generated on
- Status : TARGET REACHED
Summary of the analysis
Additional analysis
Quotes
CAMBER ENERGY INC. rating 0.1733 USD. On the day, this instrument gained +4.84% and was traded between 0.1666 USD and 0.1740 USD over the period. The price is currently at +4.02% from its lowest and -0.40% from its highest.A study of price movements over other periods shows the following variations:
Technical
Technical analysis of CAMBER ENERGY INC. in 1H shows an overall slightly bullish trend. 57.14% of the signals given by moving averages are bullish. This slightly bullish trend could be reinforced by the strong bullish signals given by short-term moving averages. The Central Indicators market scanner is currently detecting several bearish and bullish signals that could impact this trend:
Bullish trend reversal : Moving Average 100
Type : Bullish
Timeframe : 1 hour
Bullish trend reversal : adaptative moving average 50
Type : Bullish
Timeframe : 1 hour
Bearish price crossover with adaptative moving average 50
Type : Bearish
Timeframe : 1 hour
The technical indicators are bullish. There is still some doubt about the price increase.
Caution: the Central Indicators scanner currently detects an excess:
CCI indicator is overbought : over 100
Type : Neutral
Timeframe : 1 hour
RSI indicator: bearish divergence
Type : Bearish
Timeframe : 1 hour
Ichimoku : price is under the cloud
Type : Bearish
Timeframe : 1 hour
An analysis of the price chart with the Central Patterns scanner (detector of chart patterns and resistances and supports) shows a result that can have an impact on the price change:
Near resistance of channel
Type : Bearish
Timeframe : 1 hour
For a small setback in the very short term, the Central Candlesticks scanner currently notes the presence of this bearish pattern in Japanese candlesticks:
Bearish harami
Type : Bearish
Timeframe : 1 hour
| S2 | S1 | Price | R1 | R2 | R3 | |
|---|---|---|---|---|---|---|
| ProTrendLines | 0.1510 | 0.1628 | 0.1733 | 0.1844 | 0.2136 | 0.2309 |
| Change (%) | -12.87% | -6.06% | - | +6.41% | +23.25% | +33.24% |
| Change | -0.0223 | -0.0105 | - | +0.0111 | +0.0403 | +0.0576 |
| Level | Minor | Major | - | Major | Minor | Major |
Attention could also be paid to pivot points to set price objectives:
| Pivot points | S3 | S2 | S1 | PP | R1 | R2 | R3 |
|---|---|---|---|---|---|---|---|
| Standard | 0.1380 | 0.1510 | 0.1581 | 0.1711 | 0.1782 | 0.1912 | 0.1983 |
| Camarilla | 0.1598 | 0.1616 | 0.1635 | 0.1653 | 0.1671 | 0.1690 | 0.1708 |
| Woodie | 0.1352 | 0.1495 | 0.1553 | 0.1696 | 0.1754 | 0.1897 | 0.1955 |
| Fibonacci | 0.1510 | 0.1586 | 0.1634 | 0.1711 | 0.1787 | 0.1835 | 0.1912 |
| Pivot points | S3 | S2 | S1 | PP | R1 | R2 | R3 |
|---|---|---|---|---|---|---|---|
| Standard | 0.1428 | 0.1534 | 0.1590 | 0.1696 | 0.1752 | 0.1858 | 0.1914 |
| Camarilla | 0.1601 | 0.1615 | 0.1630 | 0.1645 | 0.1660 | 0.1675 | 0.1690 |
| Woodie | 0.1402 | 0.1522 | 0.1564 | 0.1684 | 0.1726 | 0.1846 | 0.1888 |
| Fibonacci | 0.1534 | 0.1596 | 0.1634 | 0.1696 | 0.1758 | 0.1796 | 0.1858 |
| Pivot points | S3 | S2 | S1 | PP | R1 | R2 | R3 |
|---|---|---|---|---|---|---|---|
| Standard | 0.0221 | 0.0866 | 0.1256 | 0.1901 | 0.2291 | 0.2936 | 0.3326 |
| Camarilla | 0.1362 | 0.1457 | 0.1552 | 0.1647 | 0.1742 | 0.1837 | 0.1932 |
| Woodie | 0.0095 | 0.0802 | 0.1130 | 0.1837 | 0.2165 | 0.2872 | 0.3200 |
| Fibonacci | 0.0866 | 0.1261 | 0.1505 | 0.1901 | 0.2296 | 0.2540 | 0.2936 |
Numerical data
The following are the details of the technical indicators and moving averages that were collected to generate this technical analysis:
| RSI (14): | 56.43 | |
| MACD (12,26,9): | -0.0002 | |
| Directional Movement: | 14.3987 | |
| AROON (14): | -28.5714 | |
| DEMA (21): | 0.1685 | |
| Parabolic SAR (0,02-0,02-0,2): | 0.1821 | |
| Elder Ray (13): | 0.0036 | |
| Super Trend (3,10): | 0.1775 | |
| Zig ZAG (10): | 0.1719 | |
| VORTEX (21): | 0.9270 | |
| Stochastique (14,3,5): | 36.82 | |
| TEMA (21): | 0.1689 | |
| Williams %R (14): | -61.19 | |
| Chande Momentum Oscillator (20): | 0.0054 | |
| Repulse (5,40,3): | 0.2351 | |
| ROCnROLL: | 1 | |
| TRIX (15,9): | -0.0834 | |
| Courbe Coppock: | 2.07 |
| MA7: | 0.1697 | |
| MA20: | 0.1702 | |
| MA50: | 0.1908 | |
| MA100: | 0.1916 | |
| MAexp7: | 0.1696 | |
| MAexp20: | 0.1690 | |
| MAexp50: | 0.1700 | |
| MAexp100: | 0.1723 | |
| Price / MA7: | +2.12% | |
| Price / MA20: | +1.82% | |
| Price / MA50: | -9.17% | |
| Price / MA100: | -9.55% | |
| Price / MAexp7: | +2.18% | |
| Price / MAexp20: | +2.54% | |
| Price / MAexp50: | +1.94% | |
| Price / MAexp100: | +0.58% |
About author

Online


Add a comment
Comments
0 comments on the analysis CAMBER ENERGY INC. - 1H