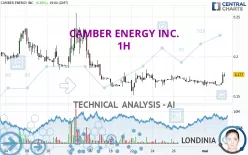
CAMBER ENERGY INC. - 1H - Technical analysis published on 05/02/2024 (GMT)
- 132
- 0
Click here for a new analysis!
- Timeframe : 1H
- - Analysis generated on
- Status : TARGET REACHED

Summary of the analysis
Additional analysis
Quotes
The CAMBER ENERGY INC. price is 0.1755 USD. The price has increased by +5.79% since the last closing with the lowest point at 0.1626 USD and the highest point at 0.1798 USD. The deviation from the price is +7.93% for the low point and -2.39% for the high point.A bullish opening was detected by the Central Gaps scanner. Buyers are trying to impose a bullish momentum in the very short term.
Bullish opening
Type : Bullish
Timeframe : Openning
Here is a more detailed summary of the historical variations registered by CAMBER ENERGY INC.:
Abnormal volumes
Timeframe : 20 days
Technical
Technical analysis of this 1H chart of CAMBER ENERGY INC. indicates that the overall trend is not clearly defined. This indecision could turn into a bullish trend due to the strong bullish signals currently being given by short-term moving averages. An assessment of moving averages reveals several bullish signals that could impact this trend:
Bullish price crossover with Moving Average 20
Type : Bullish
Timeframe : 1 hour
Bullish price crossover with Moving Average 50
Type : Bullish
Timeframe : 1 hour
Bullish price crossover with adaptative moving average 20
Type : Bullish
Timeframe : 1 hour
Bullish price crossover with adaptative moving average 50
Type : Bullish
Timeframe : 1 hour
In fact, according to the parameters integrated into the Central Analyzer system, 12 technical indicators out of 18 analysed are currently bullish. Caution: the Central Indicators scanner currently detects an excess:
CCI indicator is overbought : over 100
Type : Neutral
Timeframe : 1 hour
Williams %R indicator is overbought : over -20
Type : Neutral
Timeframe : 1 hour
Pivot points : price is over resistance 2
Type : Neutral
Timeframe : 1 hour
RSI indicator is back over 50
Type : Bullish
Timeframe : 1 hour
MACD crosses UP its Moving Average
Type : Bullish
Timeframe : 1 hour
Parabolic SAR indicator bullish reversal
Type : Bullish
Timeframe : 1 hour
Aroon indicator bullish trend
Type : Bullish
Timeframe : 1 hour
Ichimoku : price is over the cloud
Type : Bullish
Timeframe : 1 hour
The analysis of the price chart with Central Patterns scanners does not return any result.
For a small rebound in the very short term, the Central Candlesticks scanner currently notes the presence of this bullish pattern in Japanese candlesticks:
Long white line
Type : Bullish
Timeframe : 1 hour
| S2 | S1 | Price | R1 | R2 | R3 | |
|---|---|---|---|---|---|---|
| ProTrendLines | 0.1510 | 0.1605 | 0.1755 | 0.1835 | 0.2170 | 0.2309 |
| Change (%) | -13.96% | -8.55% | - | +4.56% | +23.65% | +31.57% |
| Change | -0.0245 | -0.0150 | - | +0.0080 | +0.0415 | +0.0554 |
| Level | Minor | Intermediate | - | Intermediate | Minor | Major |
Pivot points can also be used to set your price objectives. Here is the price situation in relation to pivot points:
| Pivot points | S3 | S2 | S1 | PP | R1 | R2 | R3 |
|---|---|---|---|---|---|---|---|
| Standard | 0.1546 | 0.1584 | 0.1621 | 0.1659 | 0.1696 | 0.1734 | 0.1771 |
| Camarilla | 0.1638 | 0.1645 | 0.1652 | 0.1659 | 0.1666 | 0.1673 | 0.1680 |
| Woodie | 0.1547 | 0.1584 | 0.1622 | 0.1659 | 0.1697 | 0.1734 | 0.1772 |
| Fibonacci | 0.1584 | 0.1612 | 0.1630 | 0.1659 | 0.1687 | 0.1705 | 0.1734 |
| Pivot points | S3 | S2 | S1 | PP | R1 | R2 | R3 |
|---|---|---|---|---|---|---|---|
| Standard | 0.1211 | 0.1361 | 0.1541 | 0.1691 | 0.1871 | 0.2021 | 0.2201 |
| Camarilla | 0.1631 | 0.1662 | 0.1692 | 0.1722 | 0.1752 | 0.1783 | 0.1813 |
| Woodie | 0.1227 | 0.1369 | 0.1557 | 0.1699 | 0.1887 | 0.2029 | 0.2217 |
| Fibonacci | 0.1361 | 0.1487 | 0.1565 | 0.1691 | 0.1817 | 0.1895 | 0.2021 |
| Pivot points | S3 | S2 | S1 | PP | R1 | R2 | R3 |
|---|---|---|---|---|---|---|---|
| Standard | 0.0221 | 0.0866 | 0.1256 | 0.1901 | 0.2291 | 0.2936 | 0.3326 |
| Camarilla | 0.1362 | 0.1457 | 0.1552 | 0.1647 | 0.1742 | 0.1837 | 0.1932 |
| Woodie | 0.0095 | 0.0802 | 0.1130 | 0.1837 | 0.2165 | 0.2872 | 0.3200 |
| Fibonacci | 0.0866 | 0.1261 | 0.1505 | 0.1901 | 0.2296 | 0.2540 | 0.2936 |
Numerical data
The following is the status of technical indicators and moving averages registered at the time this technical analysis was created:
| RSI (14): | 66.63 | |
| MACD (12,26,9): | -0.0006 | |
| Directional Movement: | 24.6306 | |
| AROON (14): | 78.5714 | |
| DEMA (21): | 0.1662 | |
| Parabolic SAR (0,02-0,02-0,2): | 0.1602 | |
| Elder Ray (13): | 0.0061 | |
| Super Trend (3,10): | 0.1623 | |
| Zig ZAG (10): | 0.1745 | |
| VORTEX (21): | 0.9539 | |
| Stochastique (14,3,5): | 48.58 | |
| TEMA (21): | 0.1666 | |
| Williams %R (14): | -27.68 | |
| Chande Momentum Oscillator (20): | 0.0103 | |
| Repulse (5,40,3): | 4.6630 | |
| ROCnROLL: | 1 | |
| TRIX (15,9): | -0.1090 | |
| Courbe Coppock: | 1.05 |
| MA7: | 0.1704 | |
| MA20: | 0.1847 | |
| MA50: | 0.1970 | |
| MA100: | 0.1958 | |
| MAexp7: | 0.1697 | |
| MAexp20: | 0.1672 | |
| MAexp50: | 0.1696 | |
| MAexp100: | 0.1753 | |
| Price / MA7: | +2.99% | |
| Price / MA20: | -4.98% | |
| Price / MA50: | -10.91% | |
| Price / MA100: | -10.37% | |
| Price / MAexp7: | +3.42% | |
| Price / MAexp20: | +4.96% | |
| Price / MAexp50: | +3.48% | |
| Price / MAexp100: | +0.11% |
About author

Online


Add a comment
Comments
0 comments on the analysis CAMBER ENERGY INC. - 1H