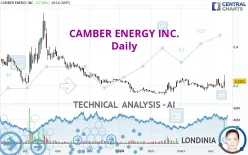
CAMBER ENERGY INC. - Daily - Technical analysis published on 04/12/2024 (GMT)
- 144
- 0
Click here for a new analysis!
- Timeframe : Daily
- - Analysis generated on
- Status : INVALID

Summary of the analysis
Additional analysis
Quotes
The CAMBER ENERGY INC. rating is 0.2221 USD. The price has increased by +17.39% since the last closing and was traded between 0.1852 USD and 0.2545 USD over the period. The price is currently at +19.92% from its lowest and -12.73% from its highest.The Central Gaps scanner detects a bullish opening marking the presence of buyers ahead of sellers at the opening but not sufficiently marked to allow the price to register a quotation gap.
Bullish opening
Type : Bullish
Timeframe : Openning
Here is a more detailed summary of the historical variations registered by CAMBER ENERGY INC.:
New HIGH record (1st january)
Type : Bullish
Timeframe : Weekly
New HIGH record (1 month)
Type : Bullish
Timeframe : Weekly
The Central Volumes scanner detects abnormal volumes on the asset:
Abnormal volumes
Timeframe : 5 days
Technical
Technical analysis of this Daily chart of CAMBER ENERGY INC. indicates that the overall trend is slightly bullish. 53.57% of the signals given by moving averages are bullish. The overall trend could accelerate as strong bullish signals from short-term moving averages are expected. An assessment of moving averages reveals several bullish signals that could impact this trend:
Bullish price crossover with Moving Average 20
Type : Bullish
Timeframe : Daily
Bullish price crossover with Moving Average 50
Type : Bullish
Timeframe : Daily
Bullish price crossover with Moving Average 100
Type : Bullish
Timeframe : Daily
Bullish price crossover with adaptative moving average 20
Type : Bullish
Timeframe : Daily
Bullish price crossover with adaptative moving average 100
Type : Bullish
Timeframe : Daily
Technical indicators are strongly bullish, suggesting that the price increase should continue.
But beware of excesses. The Central Indicators scanner currently detects this:
CCI indicator is overbought : over 100
Type : Neutral
Timeframe : Daily
Pivot points : price is over resistance 3
Type : Neutral
Timeframe : Daily
RSI indicator is back over 50
Type : Bullish
Timeframe : Daily
MACD crosses UP its Moving Average
Type : Bullish
Timeframe : Daily
Parabolic SAR indicator bullish reversal
Type : Bullish
Timeframe : Daily
Ichimoku : price is over the cloud
Type : Bullish
Timeframe : Daily
Williams %R indicator is back over -50
Type : Bullish
Timeframe : Daily
Central Patterns, the market scanner focusing on chart patterns, resistances and supports found this result:
Near horizontal resistance
Type : Bearish
Timeframe : Daily
Central Candlesticks, the scanner specialised in Japanese candlesticks, detects a bullish signal that could support the hypothesis of a small rebound in the very short term:
Long white line
Type : Bullish
Timeframe : Daily
| S1 | Price | R1 | R2 | R3 | |
|---|---|---|---|---|---|
| ProTrendLines | 0.2209 | 0.2221 | 0.5349 | 0.7929 | 1.2200 |
| Change (%) | -0.54% | - | +140.84% | +257.00% | +449.30% |
| Change | -0.0012 | - | +0.3128 | +0.5708 | +0.9979 |
| Level | Intermediate | - | Intermediate | Minor | Intermediate |
Pivot points can also be used to set your price objectives. Here is the price situation in relation to pivot points:
| Pivot points | S3 | S2 | S1 | PP | R1 | R2 | R3 |
|---|---|---|---|---|---|---|---|
| Standard | 0.1645 | 0.1737 | 0.1815 | 0.1907 | 0.1985 | 0.2077 | 0.2155 |
| Camarilla | 0.1845 | 0.1861 | 0.1876 | 0.1892 | 0.1908 | 0.1923 | 0.1939 |
| Woodie | 0.1637 | 0.1734 | 0.1807 | 0.1904 | 0.1977 | 0.2074 | 0.2147 |
| Fibonacci | 0.1737 | 0.1802 | 0.1842 | 0.1907 | 0.1972 | 0.2012 | 0.2077 |
| Pivot points | S3 | S2 | S1 | PP | R1 | R2 | R3 |
|---|---|---|---|---|---|---|---|
| Standard | 0.1520 | 0.1694 | 0.2007 | 0.2181 | 0.2494 | 0.2668 | 0.2981 |
| Camarilla | 0.2186 | 0.2231 | 0.2275 | 0.2320 | 0.2365 | 0.2409 | 0.2454 |
| Woodie | 0.1590 | 0.1729 | 0.2077 | 0.2216 | 0.2564 | 0.2703 | 0.3051 |
| Fibonacci | 0.1694 | 0.1880 | 0.1995 | 0.2181 | 0.2367 | 0.2482 | 0.2668 |
| Pivot points | S3 | S2 | S1 | PP | R1 | R2 | R3 |
|---|---|---|---|---|---|---|---|
| Standard | 0.1043 | 0.1385 | 0.1710 | 0.2052 | 0.2377 | 0.2719 | 0.3044 |
| Camarilla | 0.1853 | 0.1914 | 0.1975 | 0.2036 | 0.2097 | 0.2158 | 0.2219 |
| Woodie | 0.1036 | 0.1381 | 0.1703 | 0.2048 | 0.2370 | 0.2715 | 0.3037 |
| Fibonacci | 0.1385 | 0.1640 | 0.1797 | 0.2052 | 0.2307 | 0.2464 | 0.2719 |
Numerical data
The following is the status of the technical indicators and moving averages at the time of publication of this technical analysis:
| RSI (14): | 59.38 | |
| MACD (12,26,9): | 0.0031 | |
| Directional Movement: | 17.2376 | |
| AROON (14): | 92.8571 | |
| DEMA (21): | 0.2075 | |
| Parabolic SAR (0,02-0,02-0,2): | 0.1830 | |
| Elder Ray (13): | 0.0152 | |
| Super Trend (3,10): | 0.1770 | |
| Zig ZAG (10): | 0.2200 | |
| VORTEX (21): | 0.9380 | |
| Stochastique (14,3,5): | 44.56 | |
| TEMA (21): | 0.2072 | |
| Williams %R (14): | -39.01 | |
| Chande Momentum Oscillator (20): | 0.0370 | |
| Repulse (5,40,3): | 4.3180 | |
| ROCnROLL: | 1 | |
| TRIX (15,9): | 0.1075 | |
| Courbe Coppock: | 13.48 |
| MA7: | 0.2086 | |
| MA20: | 0.2016 | |
| MA50: | 0.1963 | |
| MA100: | 0.2090 | |
| MAexp7: | 0.2075 | |
| MAexp20: | 0.2056 | |
| MAexp50: | 0.2053 | |
| MAexp100: | 0.2493 | |
| Price / MA7: | +6.47% | |
| Price / MA20: | +10.17% | |
| Price / MA50: | +13.14% | |
| Price / MA100: | +6.27% | |
| Price / MAexp7: | +7.04% | |
| Price / MAexp20: | +8.03% | |
| Price / MAexp50: | +8.18% | |
| Price / MAexp100: | -10.91% |
About author

Online


Add a comment
Comments
0 comments on the analysis CAMBER ENERGY INC. - Daily