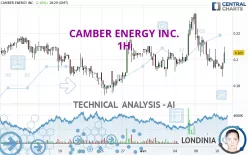
CAMBER ENERGY INC. - 1H - Technical analysis published on 04/10/2024 (GMT)
- 139
- 0
Click here for a new analysis!
- Timeframe : 1H
- - Analysis generated on
- Status : INVALID

Summary of the analysis
Additional analysis
Quotes
The CAMBER ENERGY INC. rating is 0.2088 USD. On the day, this instrument gained +4.30% and was traded between 0.1868 USD and 0.2099 USD over the period. The price is currently at +11.78% from its lowest and -0.52% from its highest.The Central Gaps scanner detects a bearish opening marking the presence of sellers ahead of buyers at the opening but not sufficiently marked to allow the price to register a quotation gap.
Bearish opening
Type : Bearish
Timeframe : Openning
Here is a more detailed summary of the historical variations registered by CAMBER ENERGY INC.:
Technical
Technical analysis of CAMBER ENERGY INC. in 1H shows an overall slightly bullish trend. Only 53.57% of the signals given by moving averages are bullish. This slightly bullish trend is not supported by the signals currently being given by short-term moving averages. The Central Indicators market scanner is currently detecting several bearish and bullish signals that could impact this trend:
Moving Average bearish crossovers : MA20 & MA50
Type : Bearish
Timeframe : 1 hour
Bullish price crossover with Moving Average 100
Type : Bullish
Timeframe : 1 hour
Bullish price crossover with adaptative moving average 50
Type : Bullish
Timeframe : 1 hour
Bullish price crossover with adaptative moving average 100
Type : Bullish
Timeframe : 1 hour
In fact, Central Analyzer took into account 18 technical indicators and the result was as follows: 4 are bullish, 6 are neutral and 8 are bearish. Other results related to technical indicators were also found by the Central Indicators scanner:
Ichimoku : price is over the cloud
Type : Bullish
Timeframe : 1 hour
Price is back under the pivot point
Type : Bearish
Timeframe : Weekly
An analysis of the price chart with the Central Patterns scanner (detector of chart patterns and resistances and supports) shows several results that can have an impact on the price change:
Near horizontal support
Type : Bullish
Timeframe : 1 hour
Support of channel is broken
Type : Bearish
Timeframe : 1 hour
There is also a Japanese candlestick pattern detected by Central Candlesticks that could mark the end of the current short-term trend:
Doji
Type : Neutral
Timeframe : 1 hour
| S2 | S1 | Price | R1 | R2 | R3 | |
|---|---|---|---|---|---|---|
| ProTrendLines | 0.1726 | 0.1869 | 0.2088 | 0.2101 | 0.2209 | 0.2354 |
| Change (%) | -17.34% | -10.49% | - | +0.62% | +5.80% | +12.74% |
| Change | -0.0362 | -0.0219 | - | +0.0013 | +0.0121 | +0.0266 |
| Level | Minor | Intermediate | - | Major | Major | Intermediate |
To determine price objectives, it is also possible to use the pivot points. Here is the price position in relation to pivot points:
| Pivot points | S3 | S2 | S1 | PP | R1 | R2 | R3 |
|---|---|---|---|---|---|---|---|
| Standard | 0.1693 | 0.1810 | 0.1906 | 0.2023 | 0.2119 | 0.2236 | 0.2332 |
| Camarilla | 0.1943 | 0.1963 | 0.1983 | 0.2002 | 0.2022 | 0.2041 | 0.2061 |
| Woodie | 0.1683 | 0.1805 | 0.1896 | 0.2018 | 0.2109 | 0.2231 | 0.2322 |
| Fibonacci | 0.1810 | 0.1891 | 0.1942 | 0.2023 | 0.2104 | 0.2155 | 0.2236 |
| Pivot points | S3 | S2 | S1 | PP | R1 | R2 | R3 |
|---|---|---|---|---|---|---|---|
| Standard | 0.1520 | 0.1694 | 0.2007 | 0.2181 | 0.2494 | 0.2668 | 0.2981 |
| Camarilla | 0.2186 | 0.2231 | 0.2275 | 0.2320 | 0.2365 | 0.2409 | 0.2454 |
| Woodie | 0.1590 | 0.1729 | 0.2077 | 0.2216 | 0.2564 | 0.2703 | 0.3051 |
| Fibonacci | 0.1694 | 0.1880 | 0.1995 | 0.2181 | 0.2367 | 0.2482 | 0.2668 |
| Pivot points | S3 | S2 | S1 | PP | R1 | R2 | R3 |
|---|---|---|---|---|---|---|---|
| Standard | 0.1043 | 0.1385 | 0.1710 | 0.2052 | 0.2377 | 0.2719 | 0.3044 |
| Camarilla | 0.1853 | 0.1914 | 0.1975 | 0.2036 | 0.2097 | 0.2158 | 0.2219 |
| Woodie | 0.1036 | 0.1381 | 0.1703 | 0.2048 | 0.2370 | 0.2715 | 0.3037 |
| Fibonacci | 0.1385 | 0.1640 | 0.1797 | 0.2052 | 0.2307 | 0.2464 | 0.2719 |
Numerical data
The following are the details of the technical indicators and moving averages that were collected to generate this technical analysis:
| RSI (14): | 43.27 | |
| MACD (12,26,9): | -0.0039 | |
| Directional Movement: | -11.5387 | |
| AROON (14): | -100.0000 | |
| DEMA (21): | 0.1976 | |
| Parabolic SAR (0,02-0,02-0,2): | 0.2062 | |
| Elder Ray (13): | -0.0068 | |
| Super Trend (3,10): | 0.2137 | |
| Zig ZAG (10): | 0.1940 | |
| VORTEX (21): | 0.8024 | |
| Stochastique (14,3,5): | 13.05 | |
| TEMA (21): | 0.1928 | |
| Williams %R (14): | -67.38 | |
| Chande Momentum Oscillator (20): | -0.0182 | |
| Repulse (5,40,3): | 0.6628 | |
| ROCnROLL: | 2 | |
| TRIX (15,9): | -0.1452 | |
| Courbe Coppock: | 18.11 |
| MA7: | 0.2068 | |
| MA20: | 0.2009 | |
| MA50: | 0.1945 | |
| MA100: | 0.2107 | |
| MAexp7: | 0.1972 | |
| MAexp20: | 0.2013 | |
| MAexp50: | 0.2030 | |
| MAexp100: | 0.2023 | |
| Price / MA7: | +0.97% | |
| Price / MA20: | +3.93% | |
| Price / MA50: | +7.35% | |
| Price / MA100: | -0.90% | |
| Price / MAexp7: | +5.88% | |
| Price / MAexp20: | +3.73% | |
| Price / MAexp50: | +2.86% | |
| Price / MAexp100: | +3.21% |
About author

Online


Add a comment
Comments
0 comments on the analysis CAMBER ENERGY INC. - 1H