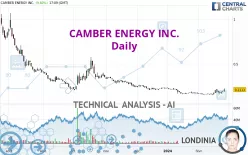
CAMBER ENERGY INC. - Daily - Technical analysis published on 02/27/2024 (GMT)
- 137
- 0
Click here for a new analysis!
- Timeframe : Daily
- - Analysis generated on
- Status : INVALID

Summary of the analysis
Additional analysis
Quotes
The CAMBER ENERGY INC. price is 0.2113 USD. The price has increased by +9.60% since the last closing with the lowest point at 0.1928 USD and the highest point at 0.2250 USD. The deviation from the price is +9.60% for the low point and -6.09% for the high point.So that you have an overall view of the price change, here is a table showing the variations over several periods:
Near a new HIGH record (1st january)
Type : Bullish
Timeframe : Weekly
New HIGH record (1 month)
Type : Bullish
Timeframe : Weekly
Technical
Technical analysis of this Daily chart of CAMBER ENERGY INC. indicates that the overall trend is slightly bullish. 53.57% of the signals given by moving averages are bullish. This slightly bullish trend could be reinforced by the strong bullish signals given by short-term moving averages. The Central Indicators market scanner currently does not detect any result that concerns moving averages.
An assessment of technical indicators shows a strong bullish signal.
Caution: the Central Indicators scanner currently detects an excess:
CCI indicator is overbought : over 100
Type : Neutral
Timeframe : Daily
Williams %R indicator is overbought : over -20
Type : Neutral
Timeframe : Daily
Pivot points : price is over resistance 2
Type : Neutral
Timeframe : Daily
MACD indicator is back over 0
Type : Bullish
Timeframe : Daily
Price is back over the pivot point
Type : Bullish
Timeframe : Weekly
An analysis of the price chart with the Central Patterns scanner (detector of chart patterns and resistances and supports) shows a result that can have an impact on the price change:
Horizontal resistance is broken
Type : Bullish
Timeframe : Daily
No result was found by the Central Candlesticks scanner on Japanese candlesticks.
| S1 | Price | R1 | R2 | R3 | |
|---|---|---|---|---|---|
| ProTrendLines | 0.2109 | 0.2113 | 0.6091 | 1.0225 | 1.2200 |
| Change (%) | -0.19% | - | +188.26% | +383.91% | +477.38% |
| Change | -0.0004 | - | +0.3978 | +0.8112 | +1.0087 |
| Level | Minor | - | Minor | Intermediate | Major |
Attention could also be paid to pivot points to set price objectives:
| Pivot points | S3 | S2 | S1 | PP | R1 | R2 | R3 |
|---|---|---|---|---|---|---|---|
| Standard | 0.1718 | 0.1777 | 0.1852 | 0.1911 | 0.1986 | 0.2045 | 0.2120 |
| Camarilla | 0.1891 | 0.1903 | 0.1916 | 0.1928 | 0.1940 | 0.1953 | 0.1965 |
| Woodie | 0.1727 | 0.1781 | 0.1861 | 0.1915 | 0.1995 | 0.2049 | 0.2129 |
| Fibonacci | 0.1777 | 0.1828 | 0.1860 | 0.1911 | 0.1962 | 0.1994 | 0.2045 |
| Pivot points | S3 | S2 | S1 | PP | R1 | R2 | R3 |
|---|---|---|---|---|---|---|---|
| Standard | 0.1105 | 0.1378 | 0.1638 | 0.1911 | 0.2171 | 0.2444 | 0.2704 |
| Camarilla | 0.1752 | 0.1801 | 0.1850 | 0.1899 | 0.1948 | 0.1997 | 0.2046 |
| Woodie | 0.1100 | 0.1375 | 0.1633 | 0.1908 | 0.2166 | 0.2441 | 0.2699 |
| Fibonacci | 0.1378 | 0.1581 | 0.1707 | 0.1911 | 0.2114 | 0.2240 | 0.2444 |
| Pivot points | S3 | S2 | S1 | PP | R1 | R2 | R3 |
|---|---|---|---|---|---|---|---|
| Standard | 0.0687 | 0.1144 | 0.1419 | 0.1876 | 0.2151 | 0.2608 | 0.2883 |
| Camarilla | 0.1494 | 0.1561 | 0.1628 | 0.1695 | 0.1762 | 0.1829 | 0.1896 |
| Woodie | 0.0597 | 0.1099 | 0.1329 | 0.1831 | 0.2061 | 0.2563 | 0.2793 |
| Fibonacci | 0.1144 | 0.1423 | 0.1596 | 0.1876 | 0.2155 | 0.2328 | 0.2608 |
Numerical data
The following is the status of the technical indicators and moving averages at the time of publication of this technical analysis:
| RSI (14): | 63.94 | |
| MACD (12,26,9): | 0.0023 | |
| Directional Movement: | 19.8767 | |
| AROON (14): | 57.1429 | |
| DEMA (21): | 0.1830 | |
| Parabolic SAR (0,02-0,02-0,2): | 0.1650 | |
| Elder Ray (13): | 0.0228 | |
| Super Trend (3,10): | 0.1518 | |
| Zig ZAG (10): | 0.2156 | |
| VORTEX (21): | 1.0673 | |
| Stochastique (14,3,5): | 69.25 | |
| TEMA (21): | 0.1954 | |
| Williams %R (14): | -26.53 | |
| Chande Momentum Oscillator (20): | 0.0416 | |
| Repulse (5,40,3): | 14.7816 | |
| ROCnROLL: | -1 | |
| TRIX (15,9): | -0.3183 | |
| Courbe Coppock: | 29.79 |
| MA7: | 0.1935 | |
| MA20: | 0.1758 | |
| MA50: | 0.1920 | |
| MA100: | 0.2554 | |
| MAexp7: | 0.1918 | |
| MAexp20: | 0.1841 | |
| MAexp50: | 0.2022 | |
| MAexp100: | 0.2869 | |
| Price / MA7: | +9.20% | |
| Price / MA20: | +20.19% | |
| Price / MA50: | +10.05% | |
| Price / MA100: | -17.27% | |
| Price / MAexp7: | +10.17% | |
| Price / MAexp20: | +14.77% | |
| Price / MAexp50: | +4.50% | |
| Price / MAexp100: | -26.35% |
About author

Online


Add a comment
Comments
0 comments on the analysis CAMBER ENERGY INC. - Daily