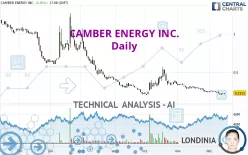
CAMBER ENERGY INC. - Daily - Technical analysis published on 12/15/2023 (GMT)
- 132
- 0
Click here for a new analysis!
- Timeframe : Daily
- - Analysis generated on
- Status : TARGET REACHED

Summary of the analysis
Additional analysis
Quotes
CAMBER ENERGY INC. rating 0.2311 USD. The price has increased by +5.05% since the last closing with the lowest point at 0.2150 USD and the highest point at 0.2318 USD. The deviation from the price is +7.49% for the low point and -0.30% for the high point.The Central Gaps scanner detects a bullish opening marking the presence of buyers ahead of sellers at the opening but not sufficiently marked to allow the price to register a quotation gap.
Bullish opening
Type : Bullish
Timeframe : Openning
Here is a more detailed summary of the historical variations registered by CAMBER ENERGY INC.:
Near a new LOW record (5 years)
Type : Bearish
Timeframe : Weekly
Near a new LOW record (1 month)
Type : Bearish
Timeframe : Weekly
Technical
A technical analysis in Daily of this CAMBER ENERGY INC. chart shows a sharp bearish trend. The signals given by moving averages are 92.86% bearish. This strong bearish trend is confirmed by the strong signals currently being given by short-term moving averages. There is no crossing of moving average by the price or crossing of moving averages between themselves.
The technical indicators are generally neutral. They do not provide relevant information on the direction of future price movements.
Caution: the Central Indicators scanner currently detects an excess:
MACD indicator: bullish divergence
Type : Bullish
Timeframe : Daily
Pivot points : price is over resistance 1
Type : Neutral
Timeframe : Daily
Price is back under the pivot point
Type : Bearish
Timeframe : Weekly
Central Patterns, the scanner specializing in chart patterns, did not identify any signals.
The Central Candlesticks scanner, specialised in Japanese candlesticks, did not identify any signals.
| S1 | Price | R1 | R2 | R3 | |
|---|---|---|---|---|---|
| ProTrendLines | 0.2128 | 0.2311 | 0.6107 | 1.2133 | 1.7889 |
| Change (%) | -7.92% | - | +164.26% | +425.01% | +674.08% |
| Change | -0.0183 | - | +0.3796 | +0.9822 | +1.5578 |
| Level | Major | - | Minor | Major | Major |
To determine price objectives, it is also possible to use the pivot points. Here is the price position in relation to pivot points:
| Pivot points | S3 | S2 | S1 | PP | R1 | R2 | R3 |
|---|---|---|---|---|---|---|---|
| Standard | 0.1943 | 0.2047 | 0.2123 | 0.2227 | 0.2303 | 0.2407 | 0.2483 |
| Camarilla | 0.2151 | 0.2167 | 0.2184 | 0.2200 | 0.2217 | 0.2233 | 0.2250 |
| Woodie | 0.1930 | 0.2040 | 0.2110 | 0.2220 | 0.2290 | 0.2400 | 0.2470 |
| Fibonacci | 0.2047 | 0.2115 | 0.2158 | 0.2227 | 0.2295 | 0.2338 | 0.2407 |
| Pivot points | S3 | S2 | S1 | PP | R1 | R2 | R3 |
|---|---|---|---|---|---|---|---|
| Standard | 0.1887 | 0.2099 | 0.2254 | 0.2466 | 0.2621 | 0.2833 | 0.2988 |
| Camarilla | 0.2309 | 0.2343 | 0.2376 | 0.2410 | 0.2444 | 0.2477 | 0.2511 |
| Woodie | 0.1860 | 0.2085 | 0.2227 | 0.2452 | 0.2594 | 0.2819 | 0.2961 |
| Fibonacci | 0.2099 | 0.2239 | 0.2326 | 0.2466 | 0.2606 | 0.2693 | 0.2833 |
| Pivot points | S3 | S2 | S1 | PP | R1 | R2 | R3 |
|---|---|---|---|---|---|---|---|
| Standard | 0.0907 | 0.1658 | 0.2050 | 0.2801 | 0.3193 | 0.3944 | 0.4336 |
| Camarilla | 0.2128 | 0.2233 | 0.2337 | 0.2442 | 0.2547 | 0.2652 | 0.2756 |
| Woodie | 0.0728 | 0.1568 | 0.1871 | 0.2711 | 0.3014 | 0.3854 | 0.4157 |
| Fibonacci | 0.1658 | 0.2095 | 0.2364 | 0.2801 | 0.3238 | 0.3507 | 0.3944 |
Numerical data
The following is the status of the technical indicators and moving averages at the time of publication of this technical analysis:
| RSI (14): | 37.99 | |
| MACD (12,26,9): | -0.0250 | |
| Directional Movement: | -12.2644 | |
| AROON (14): | -85.7143 | |
| DEMA (21): | 0.2213 | |
| Parabolic SAR (0,02-0,02-0,2): | 0.2539 | |
| Elder Ray (13): | -0.0181 | |
| Super Trend (3,10): | 0.2827 | |
| Zig ZAG (10): | 0.2309 | |
| VORTEX (21): | 0.7745 | |
| Stochastique (14,3,5): | 17.48 | |
| TEMA (21): | 0.2165 | |
| Williams %R (14): | -63.66 | |
| Chande Momentum Oscillator (20): | -0.0169 | |
| Repulse (5,40,3): | -1.1996 | |
| ROCnROLL: | 2 | |
| TRIX (15,9): | -1.1930 | |
| Courbe Coppock: | 33.36 |
| MA7: | 0.2296 | |
| MA20: | 0.2553 | |
| MA50: | 0.3158 | |
| MA100: | 0.3900 | |
| MAexp7: | 0.2306 | |
| MAexp20: | 0.2544 | |
| MAexp50: | 0.3072 | |
| MAexp100: | 0.4541 | |
| Price / MA7: | +0.65% | |
| Price / MA20: | -9.48% | |
| Price / MA50: | -26.82% | |
| Price / MA100: | -40.74% | |
| Price / MAexp7: | +0.22% | |
| Price / MAexp20: | -9.16% | |
| Price / MAexp50: | -24.77% | |
| Price / MAexp100: | -49.11% |
About author

Online


Add a comment
Comments
0 comments on the analysis CAMBER ENERGY INC. - Daily