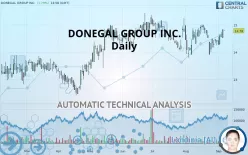
DONEGAL GROUP INC. - Daily - Technical analysis published on 09/09/2019 (GMT)
- 190
- 0
- Who voted?
Click here for a new analysis!
- Timeframe : Daily
- - Analysis generated on
- Status : INVALID

Summary of the analysis

Additional analysis
Quotes
DONEGAL GROUP INC. rating 14.78 USD. The price has increased by +1.79% since the last closing with the lowest point at 14.78 USD and the highest point at 14.78 USD. The deviation from the price is 0% for the low point and 0% for the high point.A bullish opening was detected by the Central Gaps scanner. Buyers are trying to impose a bullish momentum in the very short term.
Bullish opening
Type : Bullish
Timeframe : Openning
A study of price movements over other periods shows the following variations:
Technical
A technical analysis in Daily of this DONEGAL GROUP INC. chart shows a strongly bullish trend. 89.29% of the signals given by moving averages are bullish. The slightly bullish signals given by the short-term moving averages show a weakening of the global trend. The Central Indicators scanner does not detect any result on moving averages that would impact this trend.
On the 18 technical indicators analysed, 9 are bullish, 5 are neutral and 4 are bearish. Other results related to technical indicators were also found by the Central Indicators scanner:
Pivot points : price is over resistance 1
Type : Neutral
Timeframe : Daily
Pivot points : price is under support 1
Type : Neutral
Timeframe : Daily
Parabolic SAR indicator bullish reversal
Type : Bullish
Timeframe : Daily
Ichimoku : price is over the cloud
Type : Bullish
Timeframe : Daily
No signals are given by Central Patterns, a market scanner specialised in chart patterns, resistances and supports.
For a small rebound in the very short term, the Central Candlesticks scanner currently notes the presence of this bullish pattern in Japanese candlesticks:
Three white soldiers
Type : Bullish
Timeframe : Daily
| S3 | S2 | S1 | Price | R1 | R2 | R3 | |
|---|---|---|---|---|---|---|---|
| ProTrendLines | 13.34 | 13.91 | 14.46 | 14.78 | 14.94 | 15.27 | 15.92 |
| Change (%) | -9.74% | -5.89% | -2.17% | - | +1.08% | +3.32% | +7.71% |
| Change | -1.44 | -0.87 | -0.32 | - | +0.16 | +0.49 | +1.14 |
| Level | Intermediate | Major | Major | - | Major | Intermediate | Minor |
Pivot points can also be used to set your price objectives. Here is the price situation in relation to pivot points:
| Pivot points | S3 | S2 | S1 | PP | R1 | R2 | R3 |
|---|---|---|---|---|---|---|---|
| Standard | 14.35 | 14.44 | 14.55 | 14.64 | 14.75 | 14.84 | 14.95 |
| Camarilla | 14.60 | 14.61 | 14.63 | 14.65 | 14.67 | 14.69 | 14.71 |
| Woodie | 14.35 | 14.45 | 14.55 | 14.65 | 14.75 | 14.85 | 14.95 |
| Fibonacci | 14.44 | 14.52 | 14.57 | 14.64 | 14.72 | 14.77 | 14.84 |
| Pivot points | S3 | S2 | S1 | PP | R1 | R2 | R3 |
|---|---|---|---|---|---|---|---|
| Standard | 13.62 | 13.81 | 14.12 | 14.31 | 14.62 | 14.81 | 15.12 |
| Camarilla | 14.29 | 14.34 | 14.38 | 14.43 | 14.48 | 14.52 | 14.57 |
| Woodie | 13.68 | 13.84 | 14.18 | 14.34 | 14.68 | 14.84 | 15.18 |
| Fibonacci | 13.81 | 14.00 | 14.12 | 14.31 | 14.50 | 14.62 | 14.81 |
| Pivot points | S3 | S2 | S1 | PP | R1 | R2 | R3 |
|---|---|---|---|---|---|---|---|
| Standard | 12.59 | 13.19 | 13.81 | 14.41 | 15.03 | 15.63 | 16.25 |
| Camarilla | 14.10 | 14.21 | 14.32 | 14.43 | 14.54 | 14.65 | 14.77 |
| Woodie | 12.60 | 13.20 | 13.82 | 14.42 | 15.04 | 15.64 | 16.26 |
| Fibonacci | 13.19 | 13.66 | 13.94 | 14.41 | 14.88 | 15.16 | 15.63 |
Numerical data
The following is the status of the technical indicators and moving averages at the time of publication of this technical analysis:
| RSI (14): | 50.59 | |
| MACD (12,26,9): | 0.0000 | |
| Directional Movement: | 2.13 | |
| AROON (14): | -35.71 | |
| DEMA (21): | 14.50 | |
| Parabolic SAR (0,02-0,02-0,2): | 13.91 | |
| Elder Ray (13): | 0.17 | |
| Super Trend (3,10): | 15.10 | |
| Zig ZAG (10): | 14.52 | |
| VORTEX (21): | 1.0600 | |
| Stochastique (14,3,5): | 61.68 | |
| TEMA (21): | 14.49 | |
| Williams %R (14): | -44.04 | |
| Chande Momentum Oscillator (20): | -0.30 | |
| Repulse (5,40,3): | -0.9700 | |
| ROCnROLL: | 1 | |
| TRIX (15,9): | 0.0000 | |
| Courbe Coppock: | 3.89 |
| MA7: | 14.48 | |
| MA20: | 14.57 | |
| MA50: | 14.53 | |
| MA100: | 14.28 | |
| MAexp7: | 14.51 | |
| MAexp20: | 14.50 | |
| MAexp50: | 14.46 | |
| MAexp100: | 14.25 | |
| Price / MA7: | +2.07% | |
| Price / MA20: | +1.44% | |
| Price / MA50: | +1.72% | |
| Price / MA100: | +3.50% | |
| Price / MAexp7: | +1.86% | |
| Price / MAexp20: | +1.93% | |
| Price / MAexp50: | +2.21% | |
| Price / MAexp100: | +3.72% |
News
The latest news and videos published on DONEGAL GROUP INC. at the time of the analysis were as follows:
- Donegal Group Inc. Class A to Host Earnings Call
-
 Donegal Investment Group
-
Donegal Group
-
Donegal Investment Group
- Donegal Group Inc. Announces Fourth Quarter 2016 Webcast
About author

Online


Add a comment
Comments
0 comments on the analysis DONEGAL GROUP INC. - Daily