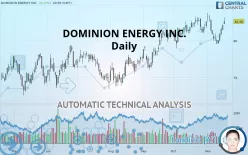
DOMINION ENERGY INC. - Daily - Technical analysis published on 11/19/2019 (GMT)
- 386
- 0
- Who voted?
Click here for a new analysis!
- Timeframe : Daily
- - Analysis generated on
- Status : INVALID

Summary of the analysis

Additional analysis
Quotes
The DOMINION ENERGY INC. rating is 82.58 USD. The price registered an increase of +0.57% on the session and was traded between 82.22 USD and 83.16 USD over the period. The price is currently at +0.44% from its lowest and -0.70% from its highest.The Central Gaps scanner detects a bullish gap which is a sign that buyers have taken the lead in the very short term.
Opening Gap UP
Type : Bullish
Timeframe : Openning
A study of price movements over other periods shows the following variations:
Near a new HIGH record (5 years)
Type : Bullish
Timeframe : Weekly
Near a new HIGH record (1 year)
Type : Bullish
Timeframe : Weekly
Near a new HIGH record (1st january)
Type : Bullish
Timeframe : Weekly
Technical
Technical analysis of this Daily chart of DOMINION ENERGY INC. indicates that the overall trend is strongly bullish. 92.86% of the signals given by moving averages are bullish. The overall trend is supported by the strong bullish signals from short-term moving averages. The Central Indicators scanner detects a bullish signal on moving averages that could impact this trend:
Bullish price crossover with Moving Average 20
Type : Bullish
Timeframe : Daily
In fact, 13 technical indicators on 18 studied are currently bullish. But beware of excesses. The Central Indicators scanner currently detects this:
Williams %R indicator is overbought : over -20
Type : Neutral
Timeframe : Daily
Pivot points : price is over resistance 1
Type : Neutral
Timeframe : Daily
Price is back over the pivot point
Type : Bullish
Timeframe : Weekly
Momentum indicator is back over 0
Type : Bullish
Timeframe : Daily
Williams %R indicator is back over -50
Type : Bullish
Timeframe : Daily
Central Patterns, the market scanner focusing on chart patterns, resistances and supports found this result:
Near horizontal resistance
Type : Bearish
Timeframe : Daily
No result was found by the Central Candlesticks scanner on Japanese candlesticks.
| S3 | S2 | S1 | Price | R1 | R2 | |
|---|---|---|---|---|---|---|
| ProTrendLines | 75.98 | 77.83 | 80.23 | 82.58 | 83.27 | 84.91 |
| Change (%) | -7.99% | -5.75% | -2.85% | - | +0.84% | +2.82% |
| Change | -6.60 | -4.75 | -2.35 | - | +0.69 | +2.33 |
| Level | Minor | Minor | Major | - | Major | Major |
To determine price objectives, it is also possible to use the pivot points. Here is the price position in relation to pivot points:
| Pivot points | S3 | S2 | S1 | PP | R1 | R2 | R3 |
|---|---|---|---|---|---|---|---|
| Standard | 80.85 | 81.12 | 81.62 | 81.89 | 82.38 | 82.66 | 83.15 |
| Camarilla | 81.90 | 81.97 | 82.04 | 82.11 | 82.18 | 82.25 | 82.32 |
| Woodie | 80.96 | 81.18 | 81.73 | 81.94 | 82.49 | 82.71 | 83.26 |
| Fibonacci | 81.12 | 81.41 | 81.59 | 81.89 | 82.18 | 82.36 | 82.66 |
| Pivot points | S3 | S2 | S1 | PP | R1 | R2 | R3 |
|---|---|---|---|---|---|---|---|
| Standard | 77.73 | 78.62 | 80.37 | 81.26 | 83.01 | 83.90 | 85.65 |
| Camarilla | 81.38 | 81.63 | 81.87 | 82.11 | 82.35 | 82.59 | 82.84 |
| Woodie | 78.15 | 78.84 | 80.79 | 81.48 | 83.43 | 84.12 | 86.07 |
| Fibonacci | 78.62 | 79.63 | 80.26 | 81.26 | 82.27 | 82.90 | 83.90 |
| Pivot points | S3 | S2 | S1 | PP | R1 | R2 | R3 |
|---|---|---|---|---|---|---|---|
| Standard | 75.64 | 77.30 | 79.92 | 81.58 | 84.20 | 85.86 | 88.48 |
| Camarilla | 81.37 | 81.77 | 82.16 | 82.55 | 82.94 | 83.34 | 83.73 |
| Woodie | 76.13 | 77.54 | 80.41 | 81.82 | 84.69 | 86.10 | 88.97 |
| Fibonacci | 77.30 | 78.93 | 79.94 | 81.58 | 83.21 | 84.22 | 85.86 |
Numerical data
The following are the details of the technical indicators and moving averages that were collected to generate this technical analysis:
| RSI (14): | 59.21 | |
| MACD (12,26,9): | 0.1000 | |
| Directional Movement: | 14.04 | |
| AROON (14): | -42.86 | |
| DEMA (21): | 81.61 | |
| Parabolic SAR (0,02-0,02-0,2): | 79.52 | |
| Elder Ray (13): | 1.26 | |
| Super Trend (3,10): | 82.61 | |
| Zig ZAG (10): | 82.58 | |
| VORTEX (21): | 1.0000 | |
| Stochastique (14,3,5): | 60.89 | |
| TEMA (21): | 81.20 | |
| Williams %R (14): | -27.32 | |
| Chande Momentum Oscillator (20): | 0.03 | |
| Repulse (5,40,3): | 1.2500 | |
| ROCnROLL: | 1 | |
| TRIX (15,9): | 0.0200 | |
| Courbe Coppock: | 2.51 |
| MA7: | 80.96 | |
| MA20: | 81.66 | |
| MA50: | 81.01 | |
| MA100: | 78.39 | |
| MAexp7: | 81.52 | |
| MAexp20: | 81.41 | |
| MAexp50: | 80.58 | |
| MAexp100: | 78.96 | |
| Price / MA7: | +2.00% | |
| Price / MA20: | +1.13% | |
| Price / MA50: | +1.94% | |
| Price / MA100: | +5.35% | |
| Price / MAexp7: | +1.30% | |
| Price / MAexp20: | +1.44% | |
| Price / MAexp50: | +2.48% | |
| Price / MAexp100: | +4.58% |
News
The latest news and videos published on DOMINION ENERGY INC. at the time of the analysis were as follows:
- Dominion Energy Acquires, Plans to Acquire Four North Carolina Solar Energy Projects
- Dominion Energy Midstream Partners Announces Second-Quarter 2017 Earnings
- Dominion Energy Announces Second-Quarter Earnings
- Founders Advantage Investee Entity Dominion Lending Centres Sells Non-Core Asset
- Dominion Energy Declares Quarterly Dividend of 75.5 Cents
About author

Online


Add a comment
Comments
0 comments on the analysis DOMINION ENERGY INC. - Daily